Street Earnings, as reflected in Zacks Earnings, are marketed as being adjusted to remove unusual income and charges. Our Core Earnings[1] show Street Earnings fail to account for a material amount of unusual income and charges, which distorts investors’ view of profitability across the S&P 500. This report shows:
- the prevalence and magnitude of overstated Street Earnings in the S&P 500,
- why Street Earnings (and GAAP earnings) are flawed and not adjusted as promised, and
- five S&P 500 companies with overstated Street Earnings and an Unattractive-or-worse Stock Rating.
212 S&P 500 Companies Overstate EPS by More than 10%
For 373 companies in the S&P 500, or 75%, Street Earnings are higher than Core Earnings[2] for the trailing-twelve-months (TTM) ended 1Q24. In the TTM ended 4Q23, 370 companies overstated their earnings.
When Street Earnings are higher than Core Earnings, they are overstated by an average of 19%, per Figure 1.
Figure 1: Street Earnings Overstated by 19% on Average in TTM Through 1Q24[3]
Sources: New Constructs, LLC and company filings.
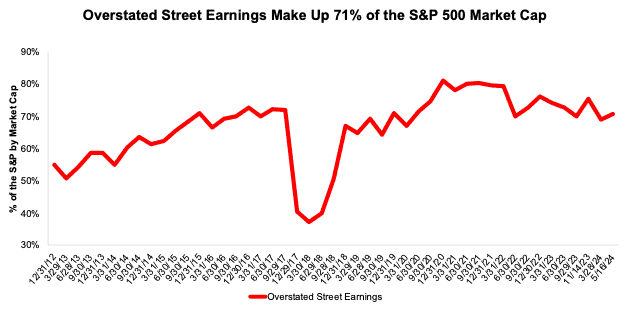
The 373 companies with overstated Street Earnings make up 71% of the market cap of the S&P 500 as of 5/16/24, which is up from 69% in 4Q23.
Note that this analysis is based on our team analyzing the financial statements and footnotes for ~3,000 10-Ks and 10-Qs filed with the SEC after earnings season. We estimate that the cost of this work for most firms would be over $2 million each quarter. To say the least, there is tremendous value in our rigorous analysis of these filings across so many companies so that our clients can discern the best and worst stocks with unrivaled diligence.
Figure 2: Overstated Street Earnings as % of Market Cap: 2012 through 5/16/24
Sources: New Constructs, LLC and company filings.
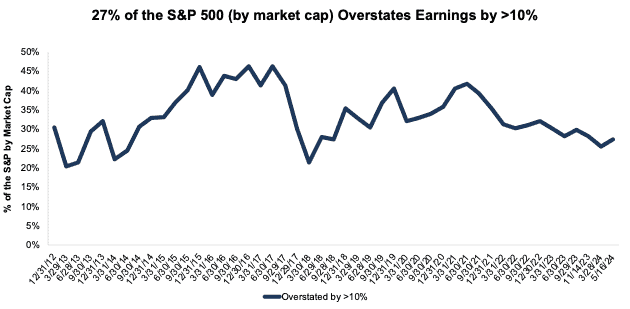
For over a third of the S&P 500 (212 companies), Street Earnings are overstated by more than 10% vs. Core Earnings. These 212 companies make up 27% of the market cap of the S&P 500 as of 5/16/24. See Figure 3.
Figure 3: Overstated Street Earnings by > 10% as % of Market Cap: 2012 through 5/16/24
Sources: New Constructs, LLC and company filings.
The Five Worst Offenders in the S&P 500
Figure 4 shows five S&P 500 stocks with an Unattractive-or-worse Stock Rating and the most overstated Street Earnings (Street Distortion as a % of Street Earnings per share) over the TTM through 1Q24. “Street Distortion” equals the difference between Core Earnings per share and Street Earnings per share. Investors using Street Earnings miss the true profitability, or lack thereof, of these businesses.
Figure 4: S&P 500 Companies with Most Overstated Street Earnings: TTM 1Q24
Sources: New Constructs, LLC and company filings.
*Measured as Street Distortion as a percent of Street EPS.
In the section below, we detail the hidden and reported unusual items that distort GAAP Earnings for NRG Energy (NRG). All of these unusual income and charges are removed from Core Earnings.


4 replies to "Street Earnings Overstated for 71% of S&P 500 in 1Q24"
NRG is among the most liquid of utilities for trading options, but what really stands out is the 96.6 IV Rank which attracts the attention of options traders. Last week, before the above research, I placed some Jul 70/95 Short Strangles and as of today, both strikes are beyond the expected move of +/-6.94. Given the 5 point options strikes, there isn’t the choice of more liquid stocks, but here is the interesting thing-the skew or risk seems to be to the upside. If I were not an NC reader, I might have been more bullish, but given the Unattractive rating, I avoided simply selling Puts (going long) at the 70 Strike. Today I could have done the same trade for a credit of maybe $2.35 instead of the $1.87 that I received. If there were $1 wide strikes, I might have skewed my trade more to the downside (for a larger credit), but given that this is a utility and given that I do not quite believe in the efficient market hypothesis as some in the options world, I remain comfortable in a trade that still has a POP of 70% and P50 of 84% as of today. The forensic accounting of NC is cautioning investors to not be fooled by the bullish skew. I hope this helps in some small way. Great analysis-only wish I could share this to spread the word more.:)
Bought back/closed above at ~50% of maximum profit and replaced with the Aug 70/90 Short Strangle. IV Rank is a high 95. Risk still to upside. Hope to exit well before 8/13 earnings. 70 strike below expected move; however, 90 strike is not given NC rating resulting in a larger $3.88 credit-the risky side of trade to me. Prepared to adjust as necessary. Utilities aren’t supposed to be volatile, right?
Earnings now indicated for 8/8. IVR is 106. Rolled 90 Call down to 85 for a modest credit & additional extrinsic value. Price below thinnish cloud-slight negative bias now. Providing Hurricane Beryl relief in Heuston area.
Extrinsic value really draining with IVR now 86.1.