Our research does not depend on luck. Every one of our stock picks must be based on unique insights, something that the market is missing. We are not looking to hope the stock gets carried along the backs of market momentum. We do not believe in MOMO, FOMO, meme stocks, etc. We believe in doing hard work to get an edge, an edge that pays a dividend.
We also believe in protecting investors’ wealth. We believe in independent research as distinct from the conflicted stuff that comes from Wall Street. We’re going to give it to you straight. And, there’s no better way to prove we’re willing to tell you truths that Wall Street cannot and will not share than with our Most Dangerous Stocks Model Portfolio.
Is there anything else like it in the business? Please let us know because we are not aware of one, especially one that’s been around since 2005 as has the Most Dangerous Stocks List.
Below we feature a stock from our Most Dangerous Stocks Model Portfolios. This feature provides a concise summary of how we pick stocks for this Model Portfolio. It is not a full Danger Zone report, but it gives you insight into the rigor of our research and approach to picking stocks. Whether you’re a subscriber or not, we think it is important that you’re able to see our research on stocks on a regular basis. We’re proud to share our work.
We’re not giving you the names of the stocks featured, because that’s only available to our Pro and Institutional members. But, there’s still so much to see here. We want you to see how much work we do; so you know where to set the bar when evaluating research providers.
We hope you enjoy this research. Feel free to share with friends and colleagues.
We update this Model Portfolio monthly. November’s Most Attractive and Most Dangerous stocks Model Portfolios were both updated and published for clients on November 6, 2024.
October Performance Recap
In the Most Dangerous Stocks Model Portfolio, the best performing large cap short stock fell by 10%, and the best performing small cap short stock fell by 19%. Overall, 18 out of the 40 Most Dangerous stocks outperformed the S&P 500 as shorts.
This report leverages our cutting-edge Robo-Analyst technology to deliver proven-superior[1] fundamental research and support more cost-effective fulfillment of the fiduciary duty of care.
Most Dangerous stocks have misleading earnings and long growth appreciation periods implied by their market valuations.
Featured Stock: Real Estate Company
This company’s NOPAT margin fell from 33% in 2018 to -7% in the TTM while invested capital turns remained still at 0.1 over the same time. Falling NOPAT margins down the company’s ROIC from 4% in 2018 to -1% in the TTM.
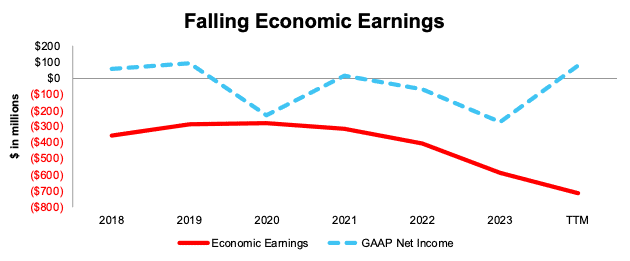
The company’s economic earnings, the true cash flows of the business, which take into account changes to the balance sheet, have fallen from -$341 million in 2018 to -$714 million in the TTM. Meanwhile GAAP net income has risen from $59 million to $78 million over the same time. Whenever GAAP earnings rise while economic earnings decline, investors should take note.
Figure 2: Economic vs GAAP Earnings Since 2018
Sources: New Constructs, LLC and company filings
This Stock Provides Poor Risk/Reward
Despite its poor and declining fundamentals, this stock is priced for significant profit growth, and we believe the stock is overvalued.
To justify its current price of $19/share, the company must improve its NOPAT margin to 39% (equal to best NOPAT margin in the last decade and above TTM NOPAT margin of -7%) and grow revenue by 10% (compared to -1% over both the 5- and 10-year periods) compounded annually through 2033. In this scenario, the company grows NOPAT 46% compounded annually to $927 million in 2033. We think these expectations are overly optimistic, especially considering the company’s highest ever NOPAT was $414 all the way back in 2008.
Even if the company improves its NOPAT margin to 33% (equal to best NOPAT margin in the last five) and grows revenue 8% compounded annually through 2033, the stock would be worth no more than $8/share today – a 60% downside to the current stock price.
Critical Details Found in Financial Filings by Our Robo-Analyst Technology
Below are specifics on the adjustments we made based on Robo-Analyst findings in this featured stock’s 10-Qs and 10-Ks:
Income Statement: we made just under $380 million in adjustments, with a net effect of removing under $300 million in non-operating expenses. Professional members can see all adjustments made to income statements on the GAAP Reconciliation tab on the Ratings page on our website.
Balance Sheet: we made over $900 million in adjustments to calculate invested capital with a net increase of over $650 million. One of the most notable adjustments was for asset write downs. Professional members can see all adjustments made to balance sheets on the GAAP Reconciliation tab on the Ratings page on our website.
Valuation: we made over $4.5 billion in adjustments to shareholder value with a net decrease of around $4.2 billion. The most notable adjustment to shareholder value was for total debt. Professional members can see all adjustments to valuations on the GAAP Reconciliation tab on the Ratings page on our website.
…there’s much more in the full report. You can start your membership here or login above to get access to this report and much more.

