Most investors know that Amazon (AMZN: $325/share) reports either low or negative earnings on a regular basis despite its annual revenue of roughly $75 billion.
Many of the AMZN bulls argue that investors looking at AMZN’s earnings are misguided, and that AMZN’s operating cash flows reveal its true profitability. CEO Jeff Bezos has repeatedly affirmed that high free cash flow, rather than EPS, is his primary goal.
Back during the tech bubble, Amazon was the poster child of a special Credit-Suisse report, Cash Flow.com, which trumpeted the capital efficiency of “new economy” companies. Authors Michael Mauboussin and Bob Hiler showed that EPS for “new economy” companies understated their true profitability or cash flows.
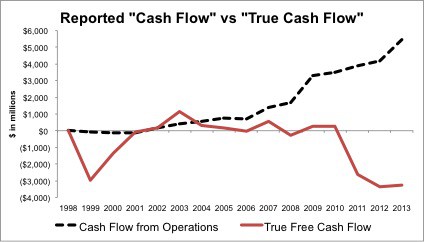
On the surface, it might seem that AMZN still generates more cash flow than EPS. AMZN reported $5.5 billion in operating cash flow in 2013. After all, companies can manipulate earnings, but it’s not as though they can manipulate cash, right? Even bearish articles accept the company’s claims of positive free cash flow, putting it at over $1 billion.
However, a closer look reveals that AMZN’s “cash flow“ is now an illusion, and its high capital efficiency days are behind it.
How the Cash Flow Statement Misleads Investors
In truth, neither AMZN’s $5.5 billion of operating cash flow nor the $1 billion in free cash flow that bulls claim reflect the actual economics of the business. There are several items that artificially inflate AMZN’s reported “operating cash flow”.
- Depreciation: AMZN recorded $3.3 billion of depreciation expense, which is added back to operating cash flows. Depreciation is technically a non-cash expense, but in reality it reflects a real cost for Amazon to do business as the company spent $3.4 billion in purchases of property and equipment (PP&E), more than offsetting the effect of depreciation. Note that capex has matched or exceeded depreciation in each of the past five years.
- Stock-based compensation: AMZN spent $1.1 billion in stock-based compensation, a non-cash expense that gets added back to operating cash flow though it, too, is a real cost of doing business. Options are simply a form of borrowing from existing shareholders to pay employees. Employees obviously see the options as having cash value or they would not accept them as compensation.
- Capital Leases: $2.7 billion of “build-to-suit” leases are also overlooked in “operating cash flows”. These leases allow Amazon to defer the large majority of the cost of these properties to make cash flow look positive in the short-term. Amazon’s use of these leases is accelerating rapidly. In 2009, it acquired just $300 million worth of property through these leases.
Another accounting loophole that makes cash flows look higher is off-balance sheet debt in the form of operating leases. These leases don’t show up on the balance sheet, income statement or cash flow statement. You have to find them deep within the financial footnotes. AMZN had $4.2 billion in off-balance sheet debt in 2013, up from $2.5 billion just two years before.
I strip away all these distortions when measuring free cash flow. My formula subtracts the change in invested capital from the after-tax cash operating profit of a business (NOPAT). By this method, we find that AMZN had a true free cash flow of negative $3.2 billion.
AMZN is not actually generating free cash flow from its business. It’s just borrowing from shareholders and deferring payments in order to mask the fact that it is losing money.
No Longer the Poster Child For New Economy Companies
There was a time when the free cash flow story for AMZN held water. From 2002 to 2010, AMZN earned positive free cash flow in seven out of nine years and averaged $300 million in FCF annually. Since then, AMZN has averaged -$3.1 billion in FCF per year. Figure 1 shows the divergence in recent years between AMZN’s reported cash flows and its actual free cash flow.
Figure 1: Free Cash Flow Negative and Declining
Sources: New Constructs, LLC and company filings.
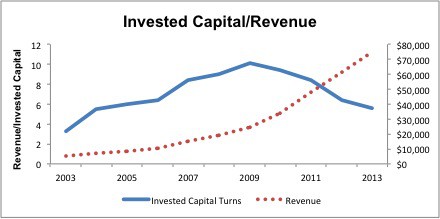
So what changed? In short, AMZN’s capital efficiency has decreased significantly in the past few years. AMZN’s high revenue growth — the metric that seems to support its lofty valuation — used to be driven by increasing capital efficiency. From 2003 until 2009, AMZN was able to drive more and more revenue from a fairly stable capital base. Since 2010, larger and larger amounts of capital have been required for incremental revenue growth. Figure 1 shows how AMZN’s invested capital turns (revenue/invested capital) have decreased rapidly since 2009.
Figure 2: Capital Efficiency Is Declining Rapidly
Sources: New Constructs, LLC and company filings.
The trend here is striking. Invested capital turns start to decline in 2010. The next year, invested capital growth accelerates. Close analysis of Amazon’s balance sheet reveals the efficiency of the business is declining rapidly.
There are other signs that suggest AMZN has to work increasingly hard to maintain its revenue growth. Advertising expense has more than quadrupled since 2009, growing significantly faster than revenues. Long-term purchase obligations for digital video content are $1 billion, up from just $300 million in 2011.
Declining Profitability
AMZN has significantly increased these discretionary costs in order to maintain revenue growth at the expense of margins. AMZN’s NOPAT margin has decreased from its peak of 4% in 2009 down to below 1% last year.
Declining margins and increasing invested capital lead to a declining return on invested capital (ROIC). AMZN earned an ROIC of 38% at its peak in 2009, but that has fallen to 4% in 2013. AMZN is growing revenue rapidly, but it is destroying value for shareholders.
These numbers suggest that AMZN can no longer achieve both top line revenue growth and cash flow.
Valuation Implies Top Line AND Cash Flow Growth
Unfortunately for AMZN bulls, the company’s valuation implies that it will manage rapid revenue growth and consistent free cash flow. In particular, AMZN’s valuation of $325/share implies that the company will increase pre-tax margins to 5% (its 2009 peak) while growing revenue by 20% compounded annually for 12 years.
If AMZN accomplishes this goal, it will average $2.7 billion in free cash flow annually over the next 12 years. Remember, this is a company that has seen negative free cash flow for the past three years.
Reviewing recent quarterly results, AMZN is already coming up short on both fronts. Not only has it continued to have negative free cash flow over the first six months of 2014, its revenue growth is down to 19% year over year, below the 20% level that its valuation implies. This slowing revenue growth is the continuation of a three-year trend.
It looks like the two data points AMZN bulls have hung their hats on, revenue growth and free cash flow, are slipping out from under their feet.
Another Shout Out To My Old Boss
This analysis reminds me of a seminal piece of work done by Michael Mauboussin back in 1995 called Plus Ca Change, Plus C’est Pareil. Mr. Mauboussin pioneered the application of return on invested capital (ROIC) in equity research and, in that report, provided strong empirical evidence that ROIC is by far the most important driver of stock market valuation.
Mr. Mauboussin also advised stock research analysts to focus more time on analyzing balance sheets because that key element of corporate performance was less picked over than income statements. His advice proves particularly apropos in this article.
Sam McBride contributed to this report.
Disclosure: David Trainer and Sam McBride receive no compensation to write about any specific stock, sector, or theme.
Photo credit: Zhao ! (Flickr)


2 replies to "3 Reasons Why Amazon’s “Cash Flow” Is A Trap"
This article is painful, especially for those who heeded the advice too closely and DIDN’T stay long AMZN from $285 to $1895. Glad I didn’t miss the 565% move!
Companies like Amazon and Netflix survive and do best in a low rate environment. Now that the Fed is in a path towards “normalization”, growth stocks like Amazon will be affected. As an investor for my own personal portfolio. I consider myself a top down investor, and I look at three things: interest rates, oil, and earnings. I consider interest rates and oil prices as an expense to business. Amazon likes to spend and build its own infrastructure. It has a lot of capital expenditures. Amazon keeps losing money on its retail business. They generate all of their profits from AWS. Because of normalized rates, there is more competition now for investor’s cash. Let’s see how the story ends. As an investor, if you want to own Amazon without the single stock risk, just buy an ETF (SPY).