Recap from February’s Picks
Our Most Attractive Stocks (+7.7%) outperformed the S&P 500 (+3.9%) last month. Most Attractive Large Cap stock Hyatt Hotels (H) gained 23% and Most Attractive Small Cap stock Asbury Automotive Group (ABG) was up 31%. Overall, 25 out of the 40 Most Attractive stocks outperformed the S&P 500 in February.
Our Most Dangerous Stocks (+7.1%) underperformed the S&P 500 (+3.9%) last month. Most Dangerous Large Cap stock Intercontinental Exchange (ICE) fell by 12% and Most Dangerous Small Cap Stock Diebold (DBD) fell by 6%. Overall, 20 out of the 40 Most Dangerous stocks outperformed the S&P 500 in February.
The successes of the Most Attractive and Most Dangerous stocks highlight the value of our forensic accounting. Being a true value investor is an increasingly difficult, if not impossible, task considering the amount of data contained in the ever-longer annual reports. By analyzing key details in these SEC filings, our research protects investors’ portfolios and allows our clients to execute value-investing strategies with more confidence and integrity.
33 new stocks make our Most Attractive list and 28 new stocks fall onto the Most Dangerous list this month. March’s Most Attractive and Most Dangerous stocks were made available to members on March 3, 2016.
Our Most Attractive stocks have high and rising return on invested capital (ROIC) and low price to economic book value ratios. Most Dangerous stocks have misleading earnings and long growth appreciation periods implied by their market valuations.
Most Attractive Stock Feature for March: Southwest Airlines (LUV: $42/share)
Southwest Airlines (LUV), passenger airline operator, is one of the additions to our Most Attractive stocks for March.
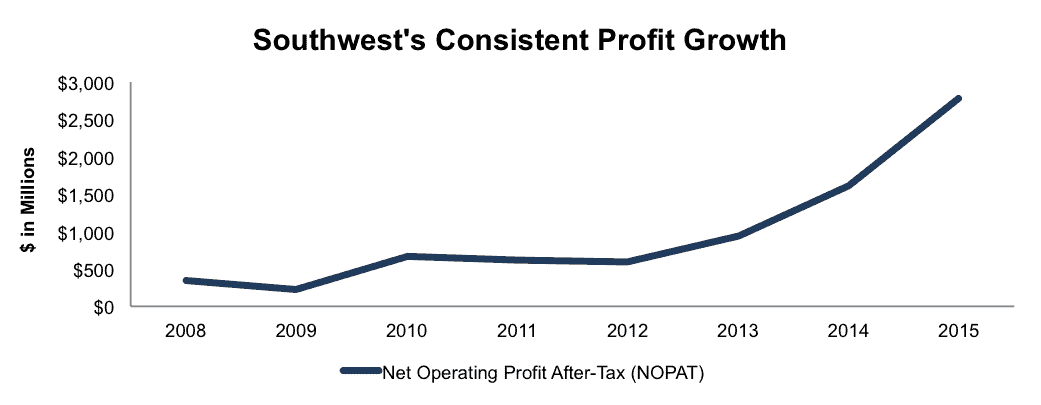
Some may argue that Southwest (and other airlines) has benefited significantly from lower oil prices and that may be correct. However, Southwest’s success has been building for multiple years, not just because of macro trends. Since 2008, Southwest’s net operating profit after-tax (NOPAT) has grown by 35% compounded annually.
Figure 1: LUV NOPAT Growth Since 2008
Sources: New Constructs, LLC and company filings
Southwest’s return on invested capital (ROIC) has improved from 3% in 2008 to a top-quintile 17% in 2015. Over this same timeframe, the company’s NOPAT margin has grown from 3% to 14%, which further highlights the increased efficiency of operations at Southwest.
Impact of Footnotes Adjustments and Forensic Accounting
In order to derive the true recurring cash flows, an accurate invested capital, and a real shareholder value, we made the following adjustments to Southwest’s 2015 10-K:
Income Statement: we made $1.4 billion of adjustments with a net effect of removing $609 million (3% of revenue) in non-operating expenses. We removed $999 million in non-operating expense and $390 million in non-operating income.
Balance Sheet: we made $8.4 billion of adjustments to calculate invested capital with a net increase of $2.9 billion. The largest adjustment was the inclusion of $2.9 billion related to off-balance sheet operating leases. This adjustment represented 22% of reported net assets.
Valuation: we made $11.4 billion of adjustments with a net effect of decreasing shareholder value by $7.2 billion. The largest adjustment, apart from the operating leases, was the removal of $2.5 billion due to the net deferred tax liabilities. This adjustment represents 9% of Southwest’s market cap. Despite the decrease in shareholder value, LUV remains undervalued.
Shares Are Significantly Undervalued
Even while LUV has increased over 77% over the past two years, shares still have upside. At its current price of $42/share, LUV has a price-to-economic book value (PEBV) ratio of 0.9. This ratio means that the market expects Southwest’s NOPAT to permanently decline by 10%. This expectation is in stark contrast from the profit growth achieved by Southwest over the past decade. If Southwest can grow NOPAT by just 5% compounded annually for the next decade, shares are worth $66/share today – a 57% upside.
Most Dangerous Stock Feature: ABM Industries (ABM: $32/share)
ABM Industries (ABM), facility maintenance solutions provider, is one of the additions to our Most Dangerous stocks for March.
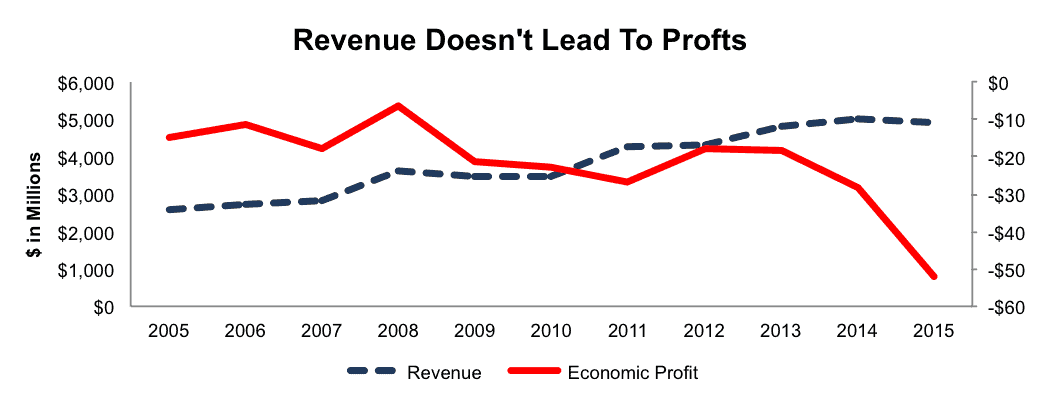
ABM Industries has been unable to turn its revenue growth into meaningful profits. Over the past decade, despite growing revenue by 6% compounded annually, ABM’s economic earnings have declined from -$15 million to -$52 million. Figure 2 has the details, including the sharp decline in economic earnings over the past four years.
Figure 2: ABM’s Declining Economic Earnings
Sources: New Constructs, LLC and company filings
Over this same time, ABM’s ROIC has fallen from 6% to a bottom-quintile 3% while its NOPAT margin has followed a similar path, declining from 2% in 2005 to 1% in 2015.
Forensic Accounting Reveals Overstated EPS
In order to derive the true recurring cash flows, an accurate invested capital, and a real shareholder value, we made the following adjustments to ABM’s 2015 10-K:
Income Statement: we made $56 million of adjustments with a net effect of removing $12 million (<1% of revenue) in non-operating income. We removed $22 million in non-operating expense and $34 million in non-operating income.
Balance Sheet: we made $432 million of adjustments to calculate invested capital with a net increase of $296 million. The largest adjustment was the inclusion of $223 million related to off-balance sheet operating leases. This adjustment represented 14% of reported net assets.
Valuation: we made $408 million of adjustments that decrease shareholder value. There were no value increasing adjustments. The largest adjustment was the removal of $381 million in total debt, which includes $223 million in operating leases. This adjustment represents 21% of ABM’s market cap.
ABM Shares Have Room To Fall
While ABM’s fundamentals have been in clear deterioration, the stock is up 30% over the past five years. To justify its current price of $32/share, ABM must grow NOPAT by 15% compounded annually for the next 18 years. Keep in mind that over the past decade, ABM has only grown NOPAT by only 3%, much lower than what the current stock price would imply.
In a more realistic scenario, even if ABM can grow NOPAT by 5% compounded annually for the next decade, the stock is worth $12/share – a 63% downside.
Disclosure: David Trainer and Kyle Guske II receive no compensation to write about any specific stock, style, or theme.

