The mid-cap blend style ranks eighth out of the twelve fund styles as detailed in my style roadmap. It gets my Dangerous rating, which is based on aggregation of fund ratings of 304 mid-cap blend funds as of Feb 13th 2012. Articles on all style and sector funds are here.
Figure 1 shows that 2,052 out of the 2,498 stocks (over 78% of the market cap) held by mid-cap blend funds get my Neutral-or-worse rating. This highlights poor stock selection and is why only one mid-cap blend fund is worthy of investment. The remaining 303 funds (over 99% of total net assets) earn my Neutral-or-worse rating and should be avoided. The takeaway is: fund managers allocate too much capital to low-quality stocks.
Investors seeking exposure to mid-cap blend stocks should buy a basket of Attractive-or-better rated stocks and avoid paying undeserved fund fees. Active management has a long history of not paying off.
As detailed in “Cheap Funds Dupe Investors”, the fund industry offers many cheap funds but very few funds with high-quality stocks, or with what I call good portfolio management.
Figure 1: Mid-cap Blend Style Landscape For Funds & Stocks
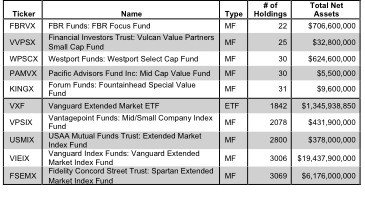
The 304 mid-cap blend funds are very different. Per Figure 2, the number of holding varies widely (from 22 to 3069), which creates drastically different investment implications and ratings. Review my full list of ratings along with free reports on all 304 mid-cap blend funds.
How do investors pick the fund that will most likely deliver the best future returns?
To identify the best funds within a given category, investors need a predictive rating based on analysis of the underlying quality of stocks in each fund. See Figure 3.
My predictive fund ratings are based on aggregating (1) my stock ratings on each of the fund’s holdings and (2) all of the fund’s expenses. Investors should not rely on backward-looking research.
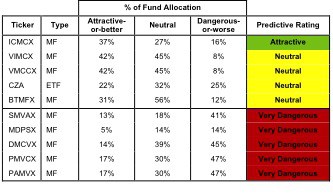
Figure 3 shows the five best and worst-rated funds for the style. The best funds allocate more value to Attractive-or-better-rated stocks than the worst funds and vice versa. The worst stocks offer poor portfolio management and high total annual costs. My ratings and reports on all funds in this style are here.
Figure 3: Funds with the Best & Worst Ratings – Top 5

Sources: New Constructs, LLC and company filings
My top-rated mid-cap blend fund is Intrepid Capital Management Funds Trust: Intrepid All Cap Fund [s: ICMCX], which gets my Attractive rating. One of its largest holdings and part of the 37% allocated to Attractive-or-better stocks is Molson Coors Brewing Company [s: TAP], which gets my Attractive rating. If there was ever a defensive business, I think it is selling alcohol. People like to drink when times are good, and they drink more when times are bad. The Molson and Coors brands are focused primarily at the lower end of the price spectrum; so they are likely to see market share gains as people look to get more beer out a shrinking budget for discretionary purchases.
The stock price tells a very different and much more somber story. At ~$43.17/share, the current valuation implies the company’s after-tax cash flow (NOPAT) will permanently decline by over 20%. In other words, if the company’s NOPAT just stays flat forever, the stock is worth over $55. I’ll drink to that.
My worst-rated mid-cap blend fund is Pacific Advisors Fund Inc: Mid Cap Value Fund [s: PAMVX], which gets my Very Dangerous rating. One of its largest holdings and part of the 47% allocated to Dangerous-or-worse stocks is Genesee & Wyoming, Inc. [s: GWR], which gets my Very Dangerous rating. One of February’s Most Dangerous stocks, GWR has both misleading earnings and an expensive valuation. The company’s earnings are misleading because in its latest 10-K (for 2010), the company reported rising and positive accounting earnings while my model showed economic earnings as negative and declining. As soon as the company releases its 2011 10-K, we will know if that trend continues. If so, investors should avoid the stock as its valuation is also dangerously high.
At ~$60/share, the current valuation implies the company will grow NOPAT organically at over 11% compounded annually for 40 years. It is hard to see any railroad firm growing much faster than GDP for very long, especially without making acquisitions. This stock has had a good run, and I think it is at the end of the line.
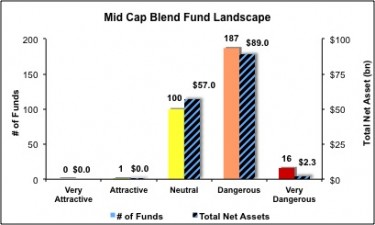
Investors need to tread carefully when considering mid-cap blend funds, as over 99% are not worth buying. Only 1 of the 304 mid-cap blend funds allocates enough value to Attractive-or-better-rated stocks to earn an Attractive rating. Figure 4 shows the rating landscape of all mid-cap blend ETFs and mutual funds.
Our style roadmap report ranks all styles and highlights those that offer the best investments.
Figure 4: Separating the Best Funds From the Worst Funds
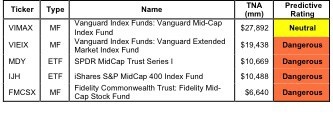
Figure 5 lists our Predictive Fund Rating for the 5 largest and most popular mid-cap blend funds.
Figure 5: Five Largest Mid-cap Blend Funds

* Analysis uses the top-ranked class for each fund
Sources: New Constructs, LLC and company filings
Review my full list of ratings and rankings along with free reports on all 304 mid-cap blend funds.
Disclosure: I receive no compensation to write about any specific stock, sector or theme.


