This purpose of this report is to show investors how New Constructs’ proprietary forensic accounting research empowers them to identify alpha-generating investment ideas more efficiently than traditional manual approaches. The report highlights ideas written by our publishing team based on insights our research technology automatically provides on a firm’s true return on invested capital (ROIC) and economic earnings.
Forensic Accounting That You Can Audit
We know from numerous case studies that changes in ROIC are directly correlated to changes in market value. As such, getting ROIC right is an important part of the investment decision making process. Our Robo-Analyst technology enables us to perform forensic accounting with scale and provide the rigorous research needed to fulfill fiduciary duties and meet sophisticated clients’ needs.
In order to reverse accounting distortions and derive true recurring cash flows (NOPAT), an accurate invested capital, and perform accurate valuations analysis, our technology makes adjustments to income statements and balance sheets for nearly 3,000 stocks.
All of these adjustments are fully auditable back to the original 10-Ks and 10-Qs.
Quantifying the Value of Our Forensic Accounting
Below, we highlight five Long Ideas and three Sell Warnings dating back to 2011 to show how our unique insights into true profits created alpha. We provide more Long Idea than Sell Warning examples because investors tend to focus more on long ideas. For all of our Long Ideas and Sell Warnings, our research team writes an ad-hoc report based primarily on the analytics from our research.
These reports show how investors can use our technology to work for them.
Figure 1: Example Stock Pick Summary
Sources: New Constructs, LLC and company filings
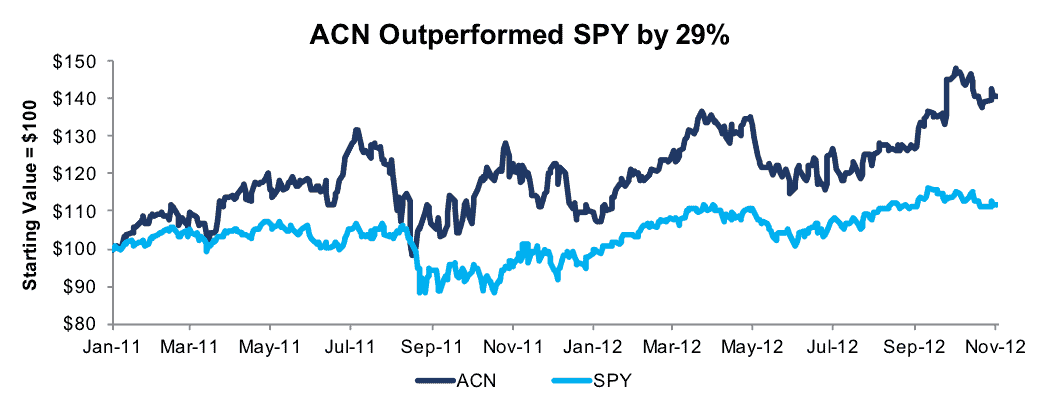
Long Idea: Accenture, PLC (ACN): +41% vs S&P +12%
Accenture was featured as a Long Idea in January, 2011. Our research revealed that ACN was among a very small group of firms (71 out of 3,000) where economic earnings exceeded accounting earnings (detail). Our research also indicated that ROIC under our methodology was rising faster than GAAP-based ROIC (detail). Both of these factors were influenced by ACN’s superior balance sheet efficiency (detail), or invested capital turns (revenue/average invested capital).
At the same time, our calculation of economic book value showed the stock’s price to economic book value (PEBV) was implying a permanent 10% decline in after-tax profit (NOPAT).
During the 671-day holding period, ACN stock gained 41% compared to 12% for the S&P 500.
Historical adjustments overview: income statement and balance sheet.
Figure 2: ACN Performance During Holding Period
Sources: New Constructs, LLC and company filings
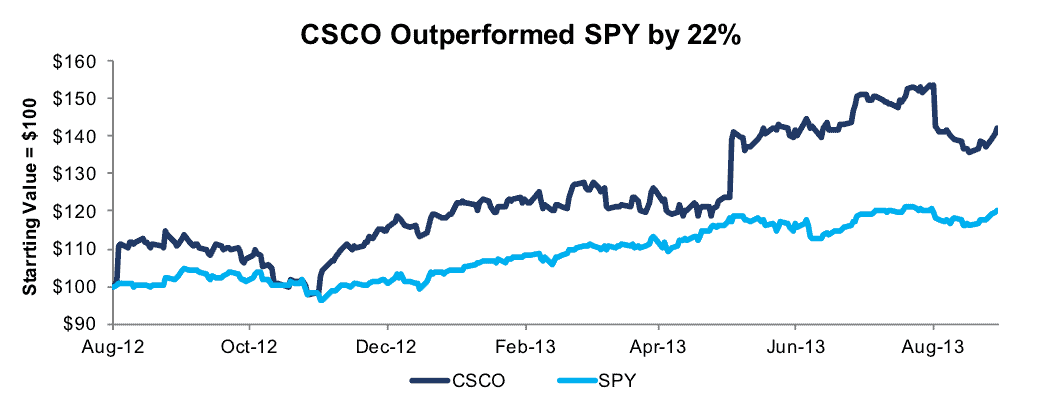
Long Idea: Cisco Systems (CSCO): +42% vs S&P +20%
Cisco Systems was featured as a Long Idea in August, 2012. Our research revealed that CSCO’s economic earnings were growing much faster than GAAP earnings during 2012 (detail). Our research also indicated that ROIC under our methodology was higher, and rising faster, than GAAP-based ROIC (detail).
At the same time, our calculation of economic book value showed CSCO was trading at the largest discount in 15 years (detail). The PEBV ratio implied a permanent 30% decline in after-tax profit (NOPAT).
Our subsequent review of CSCO’s 2012 annual report confirmed that GAAP results were in fact understating profitability and growth.
During the 393-day holding period, CSCO stock gained 42% compared to 20% for the S&P 500.
Historical adjustments overview: income statement and balance sheet.
Figure 3: CSCO’ Performance During the Holding Period
Sources: New Constructs, LLC and company filings
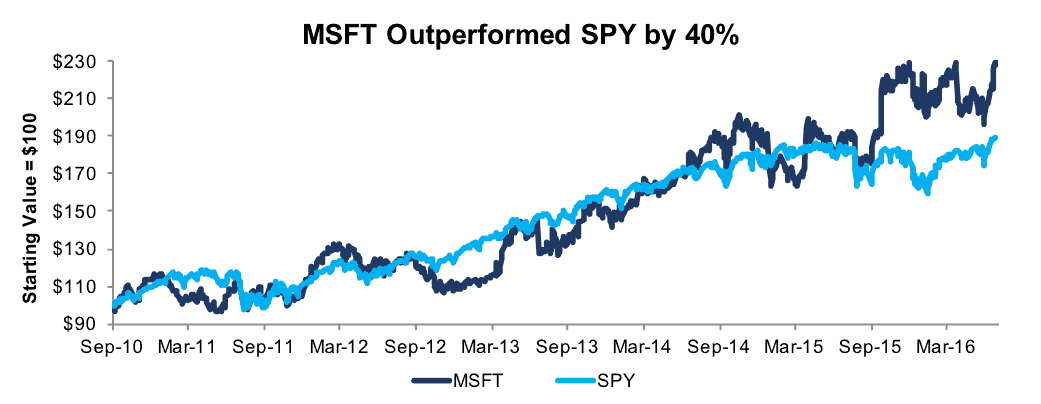
Long Idea: Microsoft (MSFT): +130% vs S&P +90%
Microsoft was featured as a Long Idea in September, 2010. Our research revealed that MSFT’s GAAP-based ROIC grossly understated the true ROIC. During the five-year period from 2010-2014, ROIC under our methodology averaged 68% compared to 30% for GAAP-based ROIC (detail), primarily due to our invested capital adjustments for growing excess cash balances (detail). The trajectory of economic earnings also confirmed the quality of MSFT’s GAAP earnings growth (detail).
At the time of selection, our calculation of MSFT’s economic book value showed that the stock’s (PEBV) valuation was implying a permanent 20% decline in after-tax profit (NOPAT).
During the nearly six-year holding period, MSFT stock gained 130% compared to 90% gain for S&P 500.
Historical adjustments overview: income statement and balance sheet.
Figure 4: MSFT’s Performance During the Holding Period
Sources: New Constructs, LLC and company filings
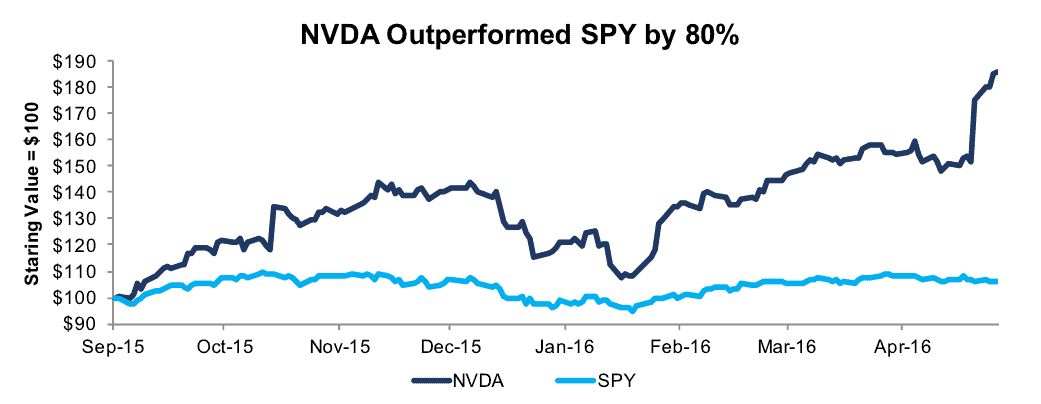
Long Idea: NVIDIA (NVDA): +86% vs S&P +6%
NVIDIA was featured as a Long Idea in September, 2015. Our research revealed that NVDA’s true ROIC, as well as its rate of change, was significantly understated by GAAP-based ROIC. From 2014-2016, ROIC under our methodology increased from 16% to 41% compared to an 8% to 12% increase in GAAP-based ROIC (detail). Over the same period, economic earnings increased from $0.34/share to $1.32/share (288%) while GAAP earnings increased from $0.74/share to $1.08/share (46%) (detail).
At the time of selection, our calculation of NVDA’s economic book value showed that the stock’s (PEBV) valuation was implying after-tax profit (NOPAT) growth of only 10% over the firm’s remaining life.
During the 237-day holding period, NVDA stock gained 86% compared to 6% for the S&P 500.
Historical adjustments overview: income statement and balance sheet.
Figure 5: NVDA’s Performance During the Holding Period
Sources: New Constructs, LLC and company filings
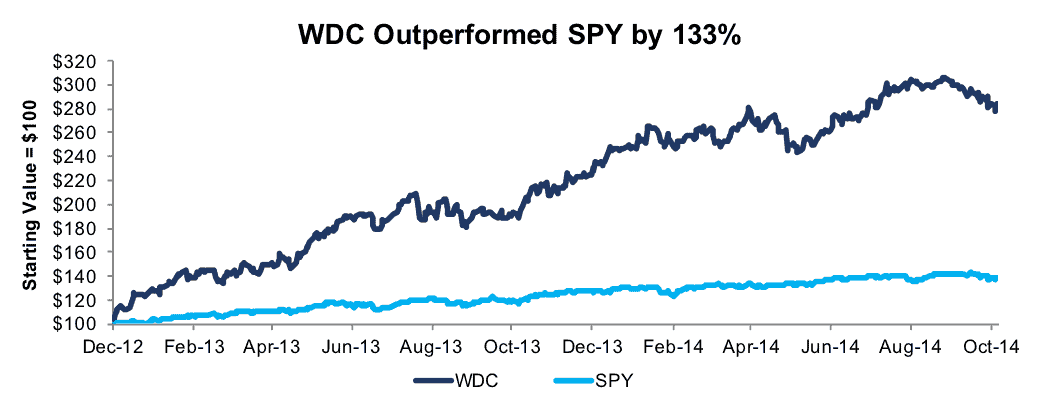
Long Idea: Western Digital (WDC): +180% vs S&P +47%
Western Digital was featured as a Long Idea in December, 2012. WDC represented a straight forward deep value call based on our analysis of economic book value (detail). WDC’s very low PEBV valuation (detail) implied that after-tax profit (NOPAT) would permanently decline by 70%, which was unduly pessimistic.
NOPAT fell by only a fraction of the market’s expectations (17%) over the next three years. Further, WDC’s 2013-2015 ROIC averaged 23% under our methodology compared to 16% for GAAP-based ROIC (detail).
During the 854-day holding period, WDC stock gained 180% compared to 47% for the S&P 500.
Historical adjustments overview: income statement and balance sheet.
Figure 6: WDC’s Performance During the Holding Period
Sources: New Constructs, LLC and company filings
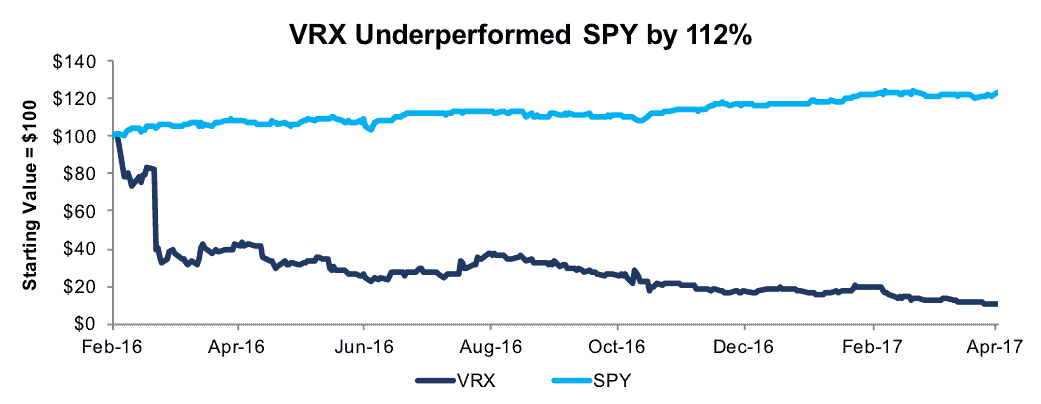
Sell Warning: Valeant Pharmaceuticals (VRX): -90% vs S&P +22%
Valeant Pharmaceuticals has declined 93% since we first started cutting through the firms dubious accounting in June 2014. VRX was later featured as a Danger Zone pick in February 2016. Our research uncovered a deep long-term decline in ROIC (detail) and economic earnings which ran counter to management’s claims of value-creating acquisitions and “non-GAAP” earnings growth (detail). Our research also showed that GAAP-based NOPAT and ROIC overstated profitability, and missed the downward inflection point, at a crucial time for investors (detail).
In addition to poor and misleading fundamentals, future profit expectations embedded in the stock price were very high. To justify the $84/share price, our model showed that VRX had to grow NOPAT by 15% compounded annually for the next 10 years.
During the 422-day holding period, VRX stock fell 90% compared to a 22% gain for the S&P 500.
Historical adjustments overview: income statement and balance sheet.
Figure 7: VRX’s Performance during the Holding Period
Sources: New Constructs, LLC and company filings
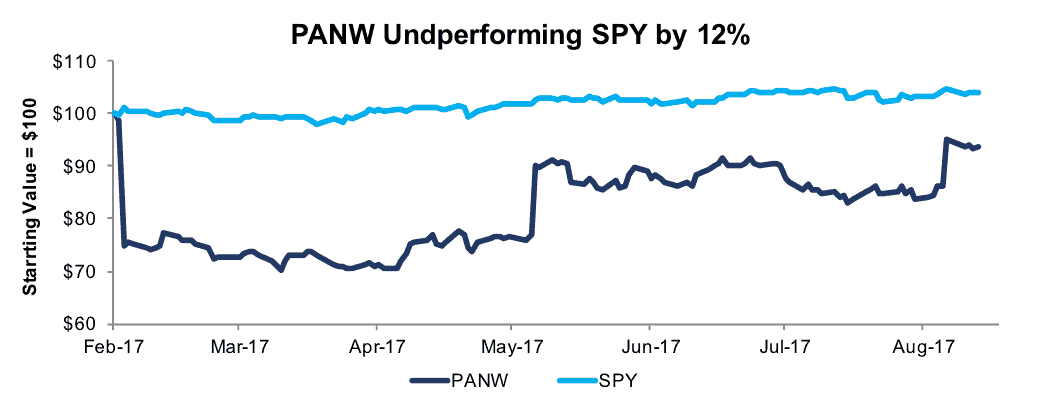
Sell Warning: Palo Alto Networks (PANW): -7% vs S&P +6%
Palo Alto Networks was featured as a Danger Zone pick in February 2017. Our research revealed a significant disconnect between strong reported revenue growth and deteriorating NOPAT (detail). Our research also identified a diverging trend between “non-GAAP” net income and economic earnings (detail). Further, PANW’s 2016 ROIC of -25% indicated profitability was worse than the -14% implied by GAAP-based ROIC (detail).
In addition to deteriorating fundamentals, future profit expectations embedded in the stock price were very high. To justify the $155/share price, our model showed that PANW had to increase NOPAT margin (from -12% to 5%) and grow revenue 31% compounded annually for eleven years.
Shortly after publication, PANW missed earnings expectations and fell 24% in one day. During the 197-day holding period, PANW has fallen 7% compared to a 6% gain for the S&P 500.
Historical adjustments overview: income statement and balance sheet.
Figure 8: PANW’s Performance During the Holding Period
Sources: New Constructs, LLC and company filings
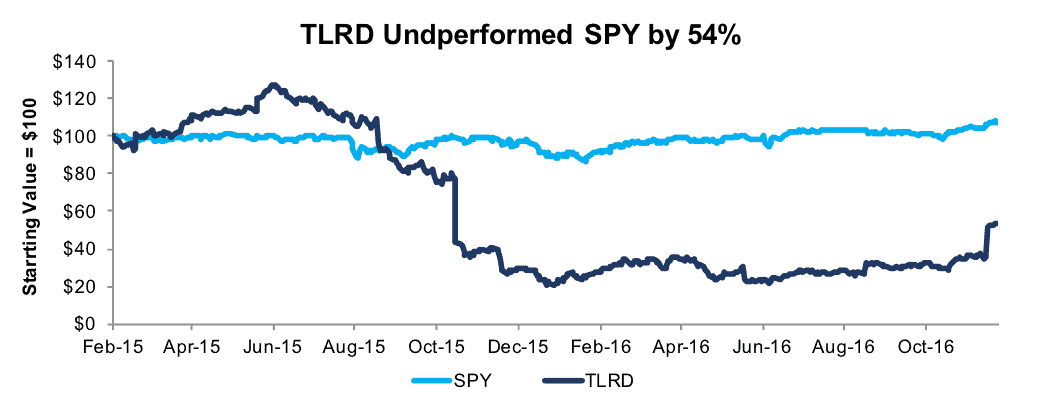
Sell Warning: Tailored Brands (TLRD): -47% vs S&P +7%
Tailored Brands (Men’s Warehouse at the time) was featured as a Danger Zone pick in February 2015. Our research uncovered that the bidding war culminating in the 2014 acquisition of Joseph A. Bank was a value-destroying proposition for shareholders. ROIC declined from 7% in 2014 to 5% in 2016. The GAAP-based ROIC was 8% in both periods (detail). Even worse, total debt costs, including implied interest from operating leases, consumed 79% of NOPAT in 2016 compared to 30% in 2014.
Funding 90% of the $1.8 billion acquisition with debt damaged the balance sheet. Further, TLRD’s crippling debt load was understated by GAAP-based ROIC which excluded $750 million in off-balance sheet operating leases (detail). Invested capital turns, or balance sheet efficiency, declined to 0.9 by 2016 from 1.3 in 2014.
Our research also showed that TLRD’s valuation had significantly diverged from economic book value (detail).
During the 661-day holding period, TLRD stock fell 47% compared to a 7% gain for the S&P 500.
Historical adjustments overview: income statement and balance sheet.
Figure 9: TLRD’s Performance During the Holding Period
Sources: New Constructs, LLC and company filings
This report originally published on September 14, 2017.
Disclosure: David Trainer, Kenneth James, and Kyle Guske II receive no compensation to write about any specific stock, style, or theme.
Follow us on Twitter, Facebook, LinkedIn, and StockTwits for real-time alerts on all our research.
Click here to download a PDF of this report.
Photo Credit: Flickr (Jack Bonner)


