When the market gets overly pessimistic about a stock, profit declines can still lead to strong returns. For example, McDonald’s (MCD) rose 51% between 2012 and 2015 while profits fell by 16%. In “The Power of Quantifying Market Expectations”, we explained how the stock outperformed because profits did not decline as much as the stock price implied.
General Motors (GM: $38/share) is this week’s Long Idea and has even more doom and gloom in its valuation than MCD had a few years ago. Overblown concerns about balance sheet liabilities, macroeconomic headwinds, and technological disruption have the market projecting the company’s cash flows will be permanently cut in half.
GM’s Valuation Implies 50% Profit Decline
Price to economic book value (PEBV) is one of our favorite valuation metrics. PEBV is the ratio of stock price to the no-growth value of the company. This no-growth value is based on the perpetuity value of after-tax cash flow (NOPAT) adjusted for all claims on capital.
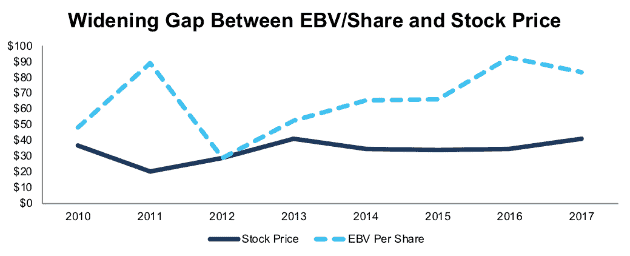
At its current valuation of ~$38/share, GM has a PEBV of 0.5. This ratio implies that the market expects GM’s NOPAT to permanently decline by 50%. Figure 1 shows that while GM’s economic book value per share has increased significantly since 2013, its stock price has remained stagnant.
Figure 1: GM’s Stock Is Far Below Its No-Growth Value
Sources: New Constructs, LLC and company filings
The gap narrowed slightly in 2017, but GM is still extremely cheap. The last time the stock was this cheap, in 2011, it doubled over the next two years even though NOPAT declined by 45%.
At its current valuation of $38/share, the market is projecting GM’s pre-tax margins to immediately decline to 4.5% (its previous low in 2012) and its revenue to decline by 3% a year for 11 years. In this scenario, GM’s NOPAT would decline by 36% in 2018 and 7% compounded annually over the next 11 years.
For the stock to do well, GM’s cash flows just need to be better than what the market expects.
GM is Cheap Even by Automaker Standards
Part of GM’s cheap valuation comes from an overall bearishness towards automakers (more on that later). All the large automakers currently have PEBV’s below 1, which means the market expects permanent profit declines for each of them. However, GM’s 0.5 PEBV is the lowest, and it also looks undervalued compared to its peers based on ROIC.
Return on invested capital (ROIC) is the most important driver of stock valuations. Numerous case studies show that getting ROIC right is an important part of making smart investments. Ernst & Young recently published a white paper that proves the material superiority of our forensic accounting research and measure of ROIC, and the technology that enables this research was featured by Harvard Business School.
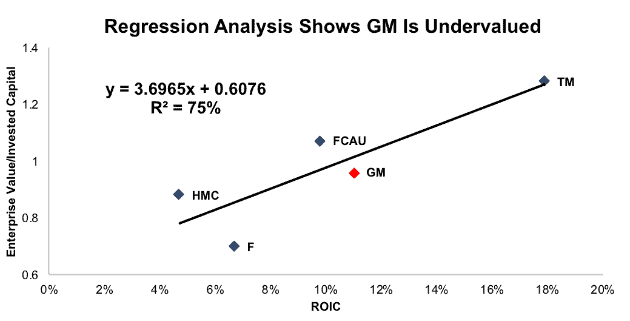
Per Figure 2, ROIC explains 75% of the difference in valuation for the five international automakers with more than $100 billion in revenue under our coverage. GM trades at a discount to its peers as shown by its position below the trend line.
Figure 2: ROIC Explains 75% of Valuation for Auto Giants
Sources: New Constructs, LLC and company filings
The only auto company that looks cheaper than GM based on this regression analysis is Ford (F), but as we’ll address below, GM is in a better position to weather the variety of challenges facing the auto industry today.
Conservative Accounting Overstates GM’s Liabilities
GM’s significant underfunded pension liabilities and the debt from GM Financial scare investors that remember 2008. However, in both situations GM’s position has meaningfully improved in recent years.
On the pension side, GM’s unfunded obligations have fallen from $36 billion in 2012 to $20 billion currently (38% of market cap). The decline in GM’s pension liability could be even more significant when considering the low discount rate, just 3.5%, it uses to measure its projected benefit obligations. Its peers use a discount rates ranging from 3.6% to 4%. If GM used a 4% discount rate, its reported pension obligation could be more than $1 billion lower.
In addition, GM uses a conservative expected return on pension plan assets of just 6.2%, significantly below Ford’s 6.75% assumption.
GM’s conservative pension accounting means its liabilities are not as significant as they might appear. It also shows that the company is more focused on maintaining a sound balance sheet rather than using accounting gimmickry to boost earnings.
The same can be said for GM Financial. Investors worry that rising interest rates or deteriorating economic conditions could cause an increase in consumer defaults. In turn, these defaults could make it hard for GM Financial to service its $80 billion in debt.
However, a look in the footnotes shows that GM is already accounting for significant deterioration. It has set its allowance for loan losses at 2.2% of finance receivables, while its peers only reserve from 0.5% to 1.4%. GM continues to reserve at a rate significantly above its peers even as the percentage of its finance receivables classified as sub-prime declined from 83% in 2014 to just 33% in 2017. GM’s significant reserves should reduce the balance sheet impact of any deterioration in credit conditions in the near future.
Tariffs and Sales Decline Concerns are Overblown
Another concern for investors is the impact of macroeconomic conditions on the auto industry. Recently announced tariffs on steel and aluminum have investors worried that automakers’ already slim margins will fall.
For GM, the tariffs shouldn’t pose any immediate problem, as the company has already negotiated its steel contracts for 2018. In the longer-term, assuming the tariffs remain in place, the impact should not be too pronounced. GM has hedges in place to account for shifts in the prices of raw materials, and analysts project tariffs to only raise overall car prices by 1%.
Another concern for investors is the decline in U.S. car sales in 2017, which was the first annual decline since the financial crisis. Automakers are pulling back production and reducing inventories to account for waning demand. Still, the decline in vehicles sold in 2017 was just 1.8%, and consumers spent more per vehicle which helps to counteract some of the decline.
GM is also well positioned to offset declining U.S. sales with gains in other markets, especially China. GM’s share of the Chinese market increased from 13.8% in 2016 to 14.3% last year. While growth in the Chinese auto market has slowed down, sales still increased by 3% in 2017. None of GM’s peers in Figure 2 had a Chinese market share above 6%. More than any other international automaker, GM looks poised to benefit from continued growth in this developing market and others that emerge.
Self-Driving and Electric Vehicles Are an Opportunity, Not a Threat
While the previous concerns address short-term problems, the rise of electric and self-driving vehicles represents the clearest long-term issue that could lead to the profit declines implied by GM’s stock price. To believe the market’s valuation of GM, you have to believe that Tesla (TSLA) will pose a real challenge.
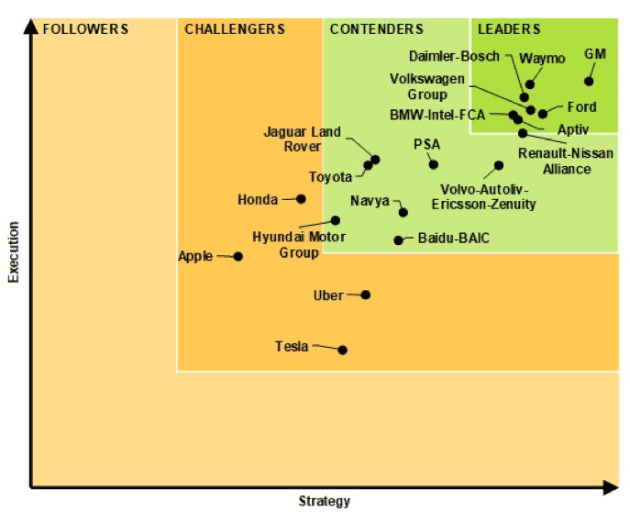
If you look past the hype, however, GM actually looks poised to beat Tesla at its own game. A recent report from Navigant Research declared GM the leader in automated driving systems, as shown in Figure 3. The company is prepared to launch fully automated cars without any steering wheels next year.
Figure 3: GM Is the Leader in Self-Driving Technologies
Sources: Navigant Research
Many believe self-driving vehicles will lead to an overall decline in cars on the road as people shift from owning their own cars to utilizing a shared fleet of on-demand self-driving cars. As much as this shift might decrease the number of total cars in use, it would increase the miles driven for each vehicle, which would lead to more wear and tear and quicker turnover. Plus, self-driving technology should increase the value of each car and deliver higher margins to manufacturers.
On the Electric Vehicle side, GM is still behind Tesla, but it’s rapidly catching up. The Chevy Bolt outsold all Tesla models last October, and the company plans to launch 18 new electric vehicles in the next five years. We find GM’s promises to deliver new vehicles easier to believe than Tesla’s.
Tesla, meanwhile, remains mired in production issues as it tries to launch its mass-market Model 3 sedan. As it turns out, 100 years of experience in manufacturing vehicles is a pretty significant competitive advantage. It’s easy to imagine a future where GM captures the market in electric and self-driving vehicles that investors have assumed Tesla will own. We won’t argue that Tesla had a significant first-move advantage in the EV market, but as the company fails to produce cars that advantage atrophies as firms with production competencies develop EV competencies.
Another key benefit to investing in GM vs TSLA: GM generates significant cash flows and pays dividends today so it is not dependent on continuously convincing the capital markets to give it more capital.
Focus on ROIC Creates Shareholder Value
Another advantage GM has over Tesla is its superior corporate governance. While Tesla’s executive compensation plan has significant flaws, GM does a good job of aligning executives with shareholders’ interests by tying executive compensation to ROIC.
Specifically, GM links 50% of long-term executive stock grants to ROIC. It adopted this measure in 2014 as a response to activist pressure and has become a key part of the company’s long-term decision making, as CFO Chuck Stevens told The Wall Street Journal in 2016:
“ROIC provides the clearest picture of how we are managing our capital and our business. It’s really starting to become part of the DNA of our decisions.”
This organizational focus has produced significant results. GM’s ROIC has increased from 8% in 2013, the year before it adopted it as a performance metric, to 11% in 2017. Economic earnings have grown by 22% compounded annually. GM’s superior corporate governance should ensure disciplined capital allocation and a focus on shareholder value creation in the future.
Significant Potential Upside
We’ve addressed why GM is unlikely to see profit declines as significant as its valuation suggests. Now, what’s the potential reward for GM shareholders?
Even with conservative assumptions, GM holds the potential for significant shareholder returns. If pre-tax margins fall to 2010 levels (5.7%) and the company’s NOPAT declines by 2% compounded annually for the next five years, the stock is worth $75/share today (99% above the current price). Investors have a chance to double their money even if profits decline over the next five years.
As discussed above, GM actually has significant growth opportunities. If it can capitalize on these opportunities, the potential for share price appreciation is much higher. If GM grows NOPAT by 3% compounded annually for 10 years, the stock is worth $111/share today (195% above the current price). This scenario may be optimistic, but it certainly doesn’t seem outside the realm of possibility.
Profit Beats and New Cars Could Send Shares Higher
With expectations so low, GM doesn’t need much to send shares higher. If it avoids the significant revenue and profit declines that analysts project in 2018, that could spur a positive run. Growth in China particularly could shift investors away from focusing on the challenges the company faces and towards appreciating its potential.
New electric and self-driving vehicles are another potential catalyst. GM has lofty goals in both of these spaces. If it can show concrete progress towards achieving these goals, investors should reward the company with a higher valuation.
Finally, the ongoing production issues at Tesla helps GM as potential TSLA buyers are forced to cancel their Model 3 pre-orders and shop elsewhere, i.e. the Chevy Bolt. Tesla has stopped publicizing its Model 3 reservation numbers, which could be a sign that the production delays have led to significant cancelations. These cancelled orders represent an opportunity for a positive surprise in Bolt sales.
Dividends and Buybacks Provide Potential 12% Yield
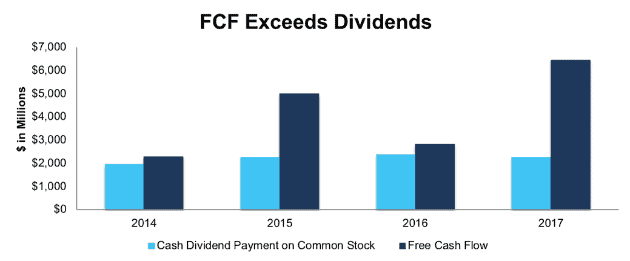
Dividends can be a great source of income to investors, but only if the company has the free cash flow necessary to support those payments. Fortunately for investors, GM has generated a cumulative $16 billion in free cash flow over the past four years, more than enough to cover its 4% dividend yield, as shown in Figure 4.
Figure 4: GM’s FCF vs. Dividends Since 2014
Sources: New Constructs, LLC and company filings
GM’s high dividend yield and steady free cash flow earn in a spot in our Safest Dividend Yields Model Portfolio.
In addition to its dividend, GM bought back $4.5 billion of stock in 2017. Combined, the company returned over 12% of its market cap to investors in the form of dividends and buybacks. Buying back its stock when shares are this cheap is a good way for GM to create value for long-term shareholders.
Insider Trading and Short Interest are Minimal
Insider trading has been minimal over the past twelve months with 1.4 million shares bought and 43 million shares sold, for a net sale of 41.6 million shares. These sales represent ~3% of shares outstanding. There are currently 33 million shares sold short, which equates to 2% of shares outstanding and 3 days to cover.
Auditable Impact of Footnotes & Forensic Accounting Adjustments
Our Robo-Analyst technology[1] enables us to perform forensic accounting with scale and provide the research needed to fulfill fiduciary duties. In order to derive the true recurring cash flows, an accurate invested capital, and an accurate shareholder value, we made the following adjustments to GM’s 2017 10-K:
Income Statement: we made $13.4 billion of adjustments, with a net effect of removing $12.4 billion in non-operating expense (8% of revenue). We removed $543 million in non-operating income and $12.9 billion in non-operating expenses. Our largest single adjustment was the removal of $7.2 billion in non-operating tax expense due to the impact of tax reform. You can see all the adjustments made to GM’s income statement here.
Balance Sheet: we made $78.7 billion of adjustments to calculate invested capital with a net decrease of $1.4 billion (2% of reported net assets). The most notable adjustment was the removal of $23.5 billion in deferred tax assets. You can see all the adjustments made to GM’s balance sheet here.
Valuation: we made $54.5 billion of adjustments with a net effect of decreasing shareholder value by $21.4 billion. Aside from the pension underfunding discussed above, the largest adjustment was $16.5 billion in excess cash. This adjustment accounts for 31% of market cap.
Attractive Funds That Hold GM
The following funds receive our Attractive-or-better rating and allocate significantly to GM.
- Fidelity Select Portfolios: Automotive Portfolio (FSAVX) – 9.6% allocation and Very Attractive rating.
- First Trust NASDAQ Transportation ETF (FTXR) – 7.4% allocation and Attractive rating.
- Nuveen Concentrated Core Fund (NCAEX) – 5.2% allocation and Very Attractive rating.
- WBI Power Factor High Dividend ETF (WBIY) – 4.7% allocation and Very Attractive rating.
This article originally published on March 15, 2018.
Disclosure: David Trainer, Sam McBride, and Kyle Guske II receive no compensation to write about any specific stock, style, or theme.
Follow us on Twitter, Facebook, LinkedIn, and StockTwits for real-time alerts on all our research.
[1] Harvard Business School features our research automation technology in “New Constructs: Disrupting Fundamental Analysis with Robo-Analysts”.
Click here to download a PDF of this report.
Photo Credit: geralt (Pixabay)


1 Response to "Doomsday Valuation Makes this Stock a Buy"
GM jumps over 10% as SoftBank invests $2.25 billion in General Motors’ autonomous vehicle unit.