Added to our Focus List – Long Model Portfolio on April 25, 2018.
After most assumed this company was headed to bankruptcy, management executed an impressive turnaround. By restructuring the business, cutting costs, cleaning up the balance sheet, and focusing on differentiation through customer service, this firm has begun to thrive despite the Amazon (AMZN) effect.
The market has recognized some of the turnaround (shares are up 40% in the past year), but investors are missing the critical role the firm could play in the next chapter of retail as well as the balance sheet story. Best Buy Co, Inc. (BBY: $73/share) is this week’s Long Idea.
BBY’s Reported Profit Understates True Profitability
Investors only analyzing reported net income might think the resurgence in BBY’s profits has ended, when in fact, due to numerous accounting loopholes, BBY’s profits are growing faster than investors realize.
In fiscal 2018, the company’s operating income includes multiple non-operating expenses that lowered its reported earnings. As shown on page 90 of BBY’s fiscal 2018 10-K, operating income includes an $80 million expense ($51 million after-tax) related to a one-time bonus for employees and $20 million charge ($13 million after tax) related to a one-time contribution to the Best Buy Foundation. In addition, on page 71 of the 2018 10-K, the company discloses a $9 million charge ($6 million after-tax) related to asset write downs in operating income.
Combined, these three charges reduce reported GAAP net income by 7%. By removing these non-recurring charges, we see that BBY’s after-tax operating profit (NOPAT) increased 2% year-over-year (YoY), which contrasts with the 19% drop in reported net income. Longer-term, Best Buy has grown NOPAT by 6% compounded annually since fiscal 2015 while net income has fallen 7% compounded annually. See Figure 1.
Figure 1: BBY’s NOPAT Grows While Net Income Declines
Sources: New Constructs, LLC and company filings
NOPAT growth has been fueled by rising NOPAT margins, which have improved from 2.1% in fiscal 2014 to 3.4% in fiscal 2018. At the same time, average invested capital turns, a measure of balance sheet efficiency, have increased from 3.1 in fiscal 2014 to 4.6 in fiscal 2018. Rising margins and efficient capital use have improved BBY’s return on invested capital (ROIC) from 7% in fiscal 2014 to a top-quintile 15% in fiscal 2018. The firm has also generated positive free cash flow each year since 2010 and a cumulative $12.5 billion (61% of market cap) in FCF over the past five years.
Embracing the Amazon Effect
In fiscal 2012, Best Buy management admitted that its struggles to grow revenue and profits were not just temporary “headwinds”, but a permanent shift in the consumer electronics retail business. They recognized the new challenges their company faced and how it needed to adapt.
In that year, the company launched its “Renew Blue” strategy, which focused on five key pillars to improve and strengthen Best Buy’s business.
- Reinvigorate the customer experience
- Attract “transformational leaders” and energize employees
- Work with vendors to innovate and drive value
- Increase the company’s ROIC by growing revenue and efficiency
- Make the world a better place through recycling efforts and giving people access to technology
With so many companies focused on short-term earnings or TSR, Best Buy’s commitment to long-term improvements in core fundamentals of its business give it a competitive advantage. The company recognized the importance of differentiating its service through the customer experience, investing in talented employees, and, most importantly, creating value for shareholders through improvements in ROIC.
Focus on Capital Stewardship Creates Competitive Advantage
Since the launch of “Renew Blue”, the company has shut down stores, exited entire regions, and looked to cut internal costs in order to compete. These strategic decisions are a case study in prudent capital allocation and balance sheet management.
Best Buy’s invested capital, the amount of cash invested in a company, has fallen from $15.6 billion in fiscal 2012, prior to the Renew Blue campaign, to $7.7 billion in fiscal 2018. Net PP&E has been cut by 30%, total debt is down 53%, and off-balance sheet operating leases are down 57%. Meanwhile, cash on hand increased from $1.2 billion in fiscal 2012 to $3.1 billion in fiscal 2018. The improvements in Best Buy’s balance sheet have created a more efficient operation that can better compete within the retail industry.
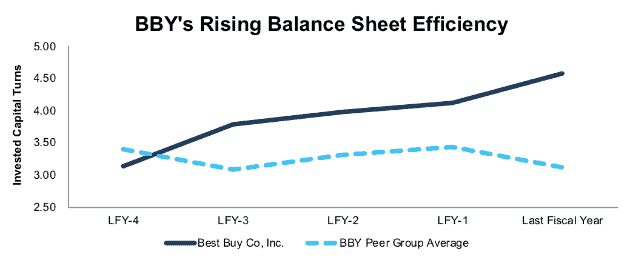
Figure 2 show’s that Best Buy’s invested capital turns, or the revenue per dollar invested in its business, have improved each of the past five years. Meanwhile, its peer group, which includes Amazon (AMZN), Costco Wholesale (COST), eBay (EBAY), Kohl’s Corporation (KSS), The Home Depot (HD), Target Corporation (TGT), Walmart Inc. (WMT), Office Depot (ODP), and more are generating less revenue per dollar of invested capital.
Figure 2: BBY’s Invested Capital Turn Improvement Over Past Five Years
Sources: New Constructs, LLC and company filings.
BBY’s Rising Margins Are a Testament to Excellent Execution
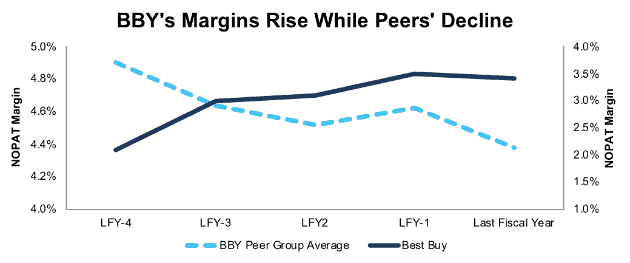
While improving its balance sheet put Best Buy on more stable footing, the company still needs to translate its growing revenue into operating profits. Since fiscal 2014, the first full year of Renew Blue, Best Buy’s NOPAT margins have improved from 2.1% to 3.4% in fiscal 2018. Meanwhile, peers’ margins have steadily declined over the same time, per Figure 3.
Figure 3: BBY’s Margin Improvement Over Last Five Years
Sources: New Constructs, LLC and company filings.
Best Buy has achieved these higher margins through strict cost control. Since fiscal 2014, gross margin has increased from 22.8% to 23.4%, while SG&A has decreased from 19.8% of revenue to 19.0%.
These higher margins are especially impressive when you consider the aggressive price match guarantee Best Buy instituted to compete with Amazon and other online retailers. Intelligent management enables this brick-and-mortar retailer to compete on price.
Bear Case Isn’t Rooted in Reality: Results Tell a Different Story
The most strident bears of Best Buy argue that e-commerce will inevitably put all brick-and-mortar retailers out of business. However, this argument ignores (1) Best Buy’s ability to grow its online and offline sales and (2) the potential profits it can garner from Amazon’s growing use of physical store locations.
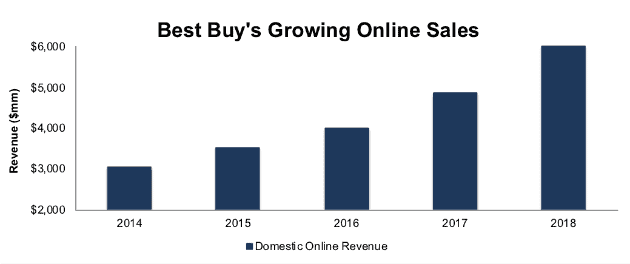
Best Buy has grown comparable store sales in each of the last four years and reported a 5.6% growth in comparable store sales in fiscal 2018. Growth in comparable online sales has been even more impressive. In its domestic segment, which makes up 90% of revenue, comparable online sales have grown double digits in each of the past five years, and over 20% in each of the past two years. Domestic online sales have grown from $3 billion (9% of domestic revenue in fiscal 2014) to nearly $6 billion (16% of domestic revenue in fiscal 2018) per Figure 4.
Figure 4: Best Buy’s Online Sales Since Fiscal 2014
Sources: New Constructs, LLC and company filings.
Best Buy’s Stores Still Create Value – Even to Amazon
Apart from its growing online presence, Best Buy’s stores provide consumers important physical interaction with products. This fact is not lost on Amazon, which has been testing out concept retail stores recently and acquired Whole Foods in 2017. Amazon actually broke out physical store sales for the first time in 3Q17, which signals that the segment is material to Amazon’s business.
These physical stores can serve as warehouses and distribution centers, as Best Buy uses its store inventory to fulfill online orders. Additionally, physical stores allow consumers to purchase online, but not have to wait for products to be shipped to their home.
For manufacturers, a retail presence is key to ensuring their products get the frontline sales focus they may need to be successful. It’s hard to trust a third party to sell your products, especially if they are strategically important, as well as you’d sell them.
In a clear sign of the importance of physical stores, Amazon and Best Buy recently announced a partnership to sell TVs powered by Amazon’s Fire TV operating system. Best Buy will sell Toshiba and Insignia (Best Buy’s private brand) TVs with Amazon’s operating system in its stores and on its website. Best Buy will also be the exclusive retailer of these TVs on Amazon.com.
As the exclusive retailer on Amazon.com, Best Buy eliminates the common concern that their stores exist solely as a showroom to online retailers. Now, consumers can see, use, and test these TVs in store, and, should they choose to purchase online, Best Buy still records the sale. Additionally, Best Buy has the opportunity to sell consumers on additional products that integrate with Amazon’s Fire TV and Alexa capable products.
This partnership proves the truth in Best Buy CEO Hubert Joly’s statement that “it’s not a zero-sum game”, when referring to competition between Best Buy and Amazon. Best Buy’s physical presence still provides value and is something Amazon cannot easily replicate.
Best Buy Could Be Amazon’s Apple Store
As Amazon continues its expansion into brick & mortar locations, it is likely considering Best Buy as an attractive acquisition target. Best Buy would provide a comparable frontline retail presence for consumer electronics to what Whole Foods provides in groceries.
Acquiring Best Buy would also allow Amazon to quality-assure the sales of its products, much like Apple (AAPL) does with its products in its retail stores. An integrated consumer experience is likely essential for Amazon to build an ecosystem to rival Apple’s.
Amazon is not the only company that may see strategic value in a frontline retail presence for products it manufactures. Alphabet (GOOGL) could benefit from stronger sales of its growing list of consumer electronics, from smart speakers to Nest products, and its Pixel smartphone.
To quantify just how much Best Buy could be worth to Amazon or another acquirer, we analyze different multiples and calculate an implied price for Best Buy. Per Figure 5, we looked at the price-to-economic book value (PEBV), price-to-earnings, price-to-NOPAT, and price-to-sales multiples for Amazon’s acquisition of Whole Foods, based on WFM’s last fiscal year prior to its acquisition. As we wrote in June of 2017, the WFM acquisition was much more expensive than people realized due to its significant hidden liabilities.
As can be seen in the analysis below, applying a similar multiple to an acquisition of Best Buy would result in a premium to the current price of 61% to 156%. One could also argue that Best Buy would garner a higher multiple as it sells higher margin products and is much more profitable than Whole Foods was when it as acquired.
Figure 5: Multiple Analysis Reveals Significant Upside in Event of Acquisition
Sources: New Constructs, LLC and company filings
Improving ROIC Correlated with Creating Shareholder Value
Numerous case studies show that getting ROIC right is an important part of making smart investments. Ernst & Young recently published a white paper that proves the material superiority of our forensic accounting research and measure of ROIC. The technology that enables this research was featured by Harvard Business School.
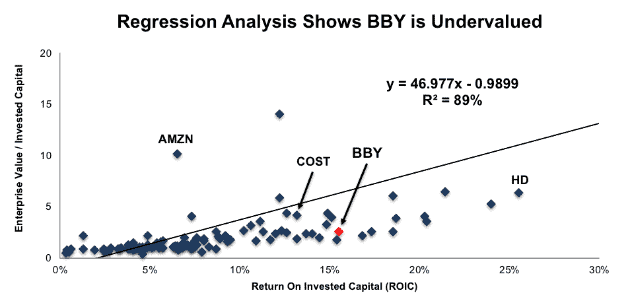
Per Figure 6, ROIC explains 89% of the difference in valuation for the 122 Retailer stocks under our coverage. BBY’s stock trades at a significant discount to peers as shown by its position below the trend line in Figure 6. BBY’s enterprise value per invested capital (a cleaner version of price to book) of 2.6 implies that the market expects its ROIC to decline to below 7%.
Figure 6: ROIC Explains 89% Of Valuation for Retailer Stocks
Sources: New Constructs, LLC and company filings
If the stock were to trade at parity with its peers, it would be worth $194/share – a 168% upside to the current stock price. Given the firm’s improving margins and ROIC, one would think the stock would garner a premium valuation. Below we’ll use our DCF model to quantify just how high shares could rise assuming conservative profit growth.
BBY Offers Significant Upside Potential
For those that still believe Best Buy has no place in an Amazon-dominated retail world, it’s important to note that BBY’s valuation already reflects this negative sentiment.
At its current price of $73/share, BBY looks undervalued by traditional ratios. BBY’s P/E ratio of 22.5 is just above the Consumer Cyclicals sector average of 22.4, despite strong profit growth, and below the S&P 500 average of 24.
When we analyze the cash flow expectations baked into the stock price, we also find that BBY holds significant upside potential. At $73/share, BBY’s price-to-economic book value (PEBV) ratio is 1.0. This ratio means the market expects BBY’s NOPAT to never meaningfully grow from current levels. This expectation seems overly pessimistic for a firm that has grown NOPAT by 12% compounded annually since 1998.
If BBY maintains fiscal 2018 NOPAT margins of 3% and grows NOPAT by just 2% compounded annually for the next decade, the stock is worth $89/share today – a 22% upside. See the math behind this dynamic DCF scenario here. Given the positive impact of the recently enacted tax legislation (details below), this margin scenario could prove conservative. Should BBY’s new strategic plan “Best Buy 2020” lead to continued revenue growth and margin improvement, the stock would hold even greater upside potential.
Tax Reform Will Help Boosts Margins
BBY stands to benefit from tax reform more than most companies as it paid a cash tax rate of 32% in 2018, which is higher than the median S&P 500 company at 28%. If Best Buy lowers its cash tax rate to the new statutory rate of 21%, it can generate 16% more NOPAT and increase its NOPAT margin from 3.4% to 4.0%.
Return to Growth Could Send Shares Higher
As Best Buy closes the chapter on its Renew Blue initiative, it starts the next chapter, which management is calling Building the New Blue. In fact, Best Buy recently announced its first store opening in seven years, a clear sign that the company has turned the page on the precarious position it once held. This new strategic plan focuses on increasing Best Buy’s position in the smart home market and launching enhanced Geek Squad support and customer service to more effectively sell to consumer needs
Focusing on the smart home market represents a strong growth opportunity for Best Buy. The Smart Home industry is predicted to grow by 14% compounded annually from 2017-2023, according to marketsandmarkets, a market research provider specializing in high growth industries. This growth rate is double Best Buy’s revenue growth rate in fiscal 2018.
Increasing and enhancing its Geek Squad and customer service also aims to differentiate and bring further value to BBY’s store locations. A support line or chat box can only go so far when answering consumer questions. By increasing its Geek Squad and customer service, including in store and in-home advisors, Best Buy looks to provide services that are best delivered in person, thereby aiming to drive consumers to its stores.
With a growing consumer electronics market (especially smart devices), strong cost management, and tailwinds from its partnership with Amazon, Best Buy could drive profit growth that exceeds the market’s low expectations. Beating expectations could send shares flying, as it did in fiscal 1Q18, when BBY jumped 22% after beating both top and bottom line expectations.
While we don’t attempt to predict exactly when the market will recognize the disconnect between expectations and Best Buy’s strong fundamentals, such a realization could prove fruitful to investors’ portfolios.
A Growing Dividend and Share Repurchases Provide Nearly 10% Yield
Best Buy has increased its annual dividend in each of the last five years and eight times within the last decade. BBY’s annual dividend has grown from $0.68/share in fiscal 2014 to $1.36/share in fiscal 2018, or 19% compounded annually. The current dividend equals a 2.5% dividend yield. Best of all, Best Buy generates the necessary cash flow to continue paying its dividend. Over the past five years, BBY has generated a cumulative $12.5 billion (61% of market cap) in free cash flow while paying $1.9 billion in dividends.
In addition to dividends, BBY has returned capital to shareholders via share repurchases. BBY has repurchased $2 billion, $751 million, and $1 billion in fiscal 2016, 2017, and 2018 respectively. In February 2017, BBY was authorized to repurchase up to $5 billion. As of February 2018, $3 billion remained available for future repurchases. BBY management announced its intent to repurchase $1.5 billion of shares in fiscal 2019, slightly above the three-year average of repurchase history. A repurchase of this size equates to 7.3% of the current market cap. When combined with the 2.5% dividend yield, the total yield to shareholders could reach 9.8%.
Executive Compensation Plan Could be Improved but Hasn’t Led to Value Destruction
Short-term incentives goals include operating income, comparable sales, and specific goals under BBY’s “Renew Blue” plan such as online revenue growth, waste and efficiency, and net promoter score. Long-term incentives are awarded via stock options and performance-based shares.
Performance-based share goals include total shareholder return and adjusted net earnings. Non-GAAP metrics such as adjusted net earnings provide management significant leeway in calculation and could lead to executives receiving bonuses while destroying shareholder value.
Through 2018, BBY has maintained ROIC improvement as one of its key metrics. While it is great to see BBY management recognize the importance of ROIC, we’d like to see them take it one step further and tie executive compensation to ROIC. There is a strong correlation between improving ROIC and increasing shareholder value[1], and tying exec comp to ROIC ensures that executives’ interests are properly aligned with shareholders’ interests.
However, despite excluding ROIC and using metrics not directly tied to increasing shareholder value, BBY’s current plan has not led to executives getting paid while destroying shareholder value. The company has improved economic earnings, the true cash flows of the business, from $368 million in fiscal 2014 to $905 million in fiscal 2018.
Insider Trading is Minimal While Short Interest Shows Pessimistic Expectations
Insider activity has been minimal over the past three months with 514 thousand shares purchased and 609 thousand shares sold for a net effect of 95 thousand shares sold. These sales represent less than 1% of shares outstanding. There are currently 32 million shares sold short, which equates to 11% of shares outstanding and nine days to cover. Short interest has decreased 3% from the prior month and is down 12% from its 52-week high. Any further improvement in Best Buy’s fundamentals could bring about a short squeeze and send shares higher.
Critical Details Found in Financial Filings By Our Robo-Analyst Technology
As investors focus more on fundamental research, research automation technology is needed to analyze all the critical financial details in financial filings. Below are specifics on the adjustments we make based on Robo-Analyst[2] findings in Best Buy’s 2018 10-K:
Income Statement: we made $523 million of adjustments, with a net effect of removing $423 million in non-operating expense (1% of revenue). We removed $50 million in non-operating income and $473 million in non-operating expenses. You can see all the adjustments made to BBY’s income statement here.
Balance Sheet: we made $7.2 billion of adjustments to calculate invested capital with a net increase of $4 billion. The most notable adjustment was $2.6 billion in operating leases. This adjustment represented 50% of reported net assets. You can see all the adjustments made to BBY’s balance sheet here.
Valuation: we made $5.2 billion of adjustments with a net effect of decreasing shareholder value by $3 billion. Apart from $4 billion in total debt, which includes the $2.6 billion in operating leases noted above, the largest adjustment to shareholder value was $1 billion in excess cash. This cash adjustment represents 5% of BBY’s market cap. Despite the decrease in shareholder value, BBY remains undervalued.
Attractive Funds That Hold BBY
The following funds receive our Attractive-or-better rating and allocate significantly to Best Buy Co, Inc.
- Mount Lucas U.S. Focused Equity Fund (BMLEX) – 10.0% allocation and Very Attractive rating.
- Strategy Shares EcoLogical Strategy ETF (HECO) – 4.2% allocation and Very Attractive rating.
- Catalyst/Lyons Tactical Allocation Fund (CLTCX) – 3.7% allocation and Very Attractive rating.
- State Street SPDR MFS Systematic Core Equity ETF (SYE) – 3.6% allocation and Very Attractive rating.
- SunAmerica AIG ESG Dividend Fund (EDFCX) – 3.3% allocation and Very Attractive rating.
This article originally published on April 25, 2018.
Disclosure: David Trainer, Kyle Guske II, and Sam McBride receive no compensation to write about any specific stock, style, or theme.
Follow us on Twitter, Facebook, LinkedIn, and StockTwits for real-time alerts on all our research.
[1] Harvard Business School features the powerful impact of our research automation technology in the case New Constructs: Disrupting Fundamental Analysis with Robo-Analysts.
[2] Ernst & Young’s recent white paper “Getting ROIC Right” proves the superiority of our holdings research and analytics.
Click here to download a PDF of this report.
Photo Credit: FancyCrave (Pexels)
