We published an update on GNTX on February 16, 2022. A copy of the associated Earnings Update report is here.
We closed the RDN position on August 18, 2021. A copy of the associated Position Update report is here.
As economic earnings across the market continue their decline, a focus on return on invested capital (ROIC) provides an important competitive advantage that helps companies outperform.
The success of companies that prioritize capital allocation, along with pressure from the investment community, has led to a greater emphasis on ROIC among executives. So far in 2019, we’ve found 17 companies with a combined market cap of ~$90 billion that have added ROIC to their executive compensation plans. Two of these companies stand out for their undervalued stocks and rising profits, in addition to their improved corporate governance. Gentex Corporation (GNTX: $21/share) and Radian Group (RDN: $23/share) are this week’s Long Ideas.
Focus on ROIC – It Drives Valuations
Companies that earn a high ROIC tend to outperform in many different market cycles. Furthermore, there is a strong correlation between improving ROIC and increasing shareholder value. To that end, we began our search looking for companies that recently added ROIC (or a similar metric) to their executive compensation plan. These firms are telling markets that intelligent capital allocation is a priority.
In addition to linking ROIC to executive compensation, both GNTX and RDN are high-quality, value creating businesses that grew economic earnings in 2018. However, as Figure 1 shows, the expectations baked into their stock prices – as measured by their price to economic book value (PEBV) ratios – imply no profit (NOPAT) growth. PEBV compares the current valuation of a company to its zero-growth value, so a PEBV of 1 means that the market expects the company’s cash flows to remain flat into perpetuity.
Figure 1: Two Stocks Focusing on Improving ROIC

Sources: New Constructs, LLC and company filings
Gentex Corporation (GNTX)
We first recommended Gentex (GNTX) in December 2016. Through the middle of January 2019, the stock had performed nearly in-line with the S&P 500. However, since late January, the stock is down nearly 10%, and investors should take this opportunity to buy the dip.
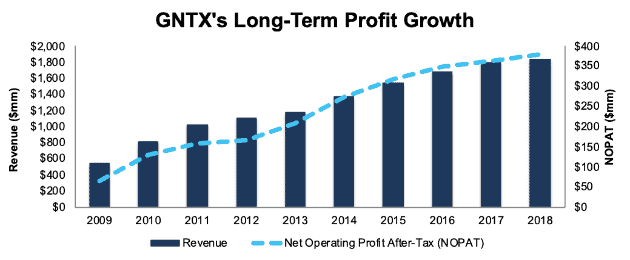
Over the past decade, GNTX has grown revenue by 11% compounded annually and NOPAT by 18% compounded annually. Profit growth has been achieved through margin expansion and intelligent capital allocation. NOPAT margins have improved from 20% to 21% over the past five years, while average invested capital turns, a measure of balance sheet efficiency, have increased from 1.0 to 1.2 over the same time.
Rising margins and efficient capital use have improved GNTX’s ROIC from 21% in 2014 to its current 25%. More impressively, the company has earned a double-digit ROIC in each year of our model, which dates back to 1998.
Figure 2: GNTX’s Revenue & NOPAT Since 2009

Sources: New Constructs, LLC and company filings
Focusing on Capital Allocation: While GNTX’s long-term track record of growth and profitability is impressive, the company has not made capital allocation a priority in the past. Instead, executive bonuses were tied to EBITDA and EPS. As we’ve shown, focusing on these metrics can lead companies into value-destroying strategies.
Fortunately for investors, GNTX updated its compensation plan in 2019. GNTX now uses three-year ROIC as a performance metric in its long-term incentive plan. The long-term incentive plan makes up 50% of GNTX’s CEO’s pay and 36% of other executives’ pay. GNTX notes in its proxy statement announcing the change to exec comp that “ROIC ensures management uses our capital in an effective manner that drives shareholder return.”
Now that GNTX is focusing on ROIC, we expect it to create even more value for investors. The inclusion of ROIC in its executive compensation plan also lowers the risk of investing in GNTX as we know executives’ interests are aligned with shareholders’ interests. Going forward, if executives want to get paid, they must allocate capital intelligently.
Strong Competitive Advantages: GNTX’s profitability provides key competitive advantages, such as a dominant market share. GNTX currently holds 92% of the worldwide automatic dimming rearview mirror market, which is up from 83% in 2008. Its NOPAT margin and ROIC rank the highest among all 32 Auto, Truck, and Motorcycle parts firms under coverage. Best of all, its ROIC is more than double and its NOPAT margin is more than triple its closest competitor, Magna International (MGA).
Don’t Overlook Undervalued Shares: At its current price of $21/share, GTNX looks cheap even according to traditional valuation metrics. Its P/E ratio of 13 is well below the average of the Consumer Cyclicals sector at 20, and the overall market at 22.
GNTX currently has a PEBV ratio of 1.0. This ratio means the market expects GNTX’s NOPAT never to grow from current levels. This expectation seems rather pessimistic for a firm that has grown NOPAT by 18% compounded annually over the past decade and 12% compounded annually over the past two decades.
If GNTX can maintain 2018 margins (21%) and grow NOPAT by just 4% compounded annually for the next decade, the stock is worth $26/share today – a 24% upside. See the math behind this dynamic DCF scenario.
Radian Group (RDN)
As a private mortgage insurance provider, Radian Group gets lumped in with other financial firms when investors worry about economic growth slowing, or worse, a recession. However, the company’s fundamentals have consistently improved in recent years, and its business looks much more stable than before the last recession.
However, the stock is priced as if profits will permanently decline by 20%, which creates a buying opportunity. Even after a 36% increase year-to-date, we still see significant upside.
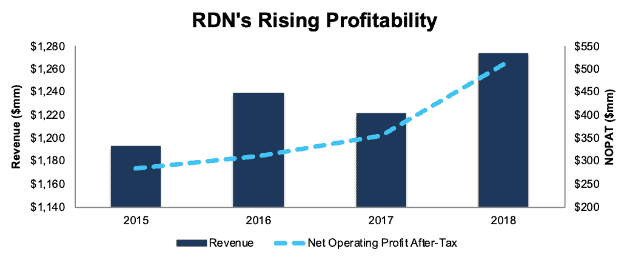
Since 2015, RDN has grown revenue by 2% compounded annually and NOPAT by 21% compounded annually. This profit growth has been fueled by improving margins, as its NOPAT margin has improved from 24% in 2015 to 40% in 2018 while its ROIC improved from 12% in 2014 to 14% in 2018.
Figure 3: RDN’s Revenue & NOPAT Since 2015

Sources: New Constructs, LLC and company filings
Focusing on Capital Allocation: As Figure 3 shows, RDN has been able to grow revenue and profits in the past, despite not explicitly incentivizing executives with the proper metrics. Going forward, RDN will include “return on capital”, which is similar to ROIC, in the performance metrics used to award executives’ short-term bonuses. These bonuses represent ~27% of RDN executive’s pay. In prior years, RDN used “capital management”, a more qualitative and less rigorous measure. By stepping up to return on capital, RDN will hold executives even more accountable for prudent capital stewardship.
As with GNTX above, including return on capital in its executive compensation plan lowers the risk of investing in RDN as its aligns executives’ interests directly with shareholders’. Furthermore, with a clearer focus on capital allocation, RDN should create even more value for investors in the future.
Market Concerns Overblown: Because RDN deals with mortgages, investors are always wary of the next recession or possible housing downturn. However, RDN’s business is much healthier than it was before the housing crisis in 2008. In 2007, only 29% of new insurance written was to clients with a FICO score above 740. In 2018, that level increased to 61%. Furthermore, in 2007, just 26% of total risk in force (RIF), which measures RDN’s total exposure to underlying loans, had FICO scores above 740. In 2018, 59% of RIF has FICO scores above 740.
In addition, RDN’s portfolio of business written after 2008 represents approximately 94% of its total RIF. Overall, RDN’s business is less susceptible to downturns in the housing market as its portfolio consists of much higher quality borrowers.
Don’t Overlook Undervalued Shares: At its current price of $23/share, RDN looks cheap both by traditional metrics and through our DCF model. It’s P/E ratio of 8 is below the Financials sector average of 14 and market average of 22.
RDN has a PEBV ratio of 0.8. This ratio means the market expects RDN’s NOPAT to decline by 20% over the remainder of its corporate life. Such expectations seem pessimistic for a firm that has grown NOPAT by 21% compounded annually since 2015 and 9% compounded annually since 1998.
Even if RDN were to never grow NOPAT again, its economic book value (EBV), or no-growth value of the stock, is $29/share – a 26% upside from the current price.
However, if RDN can maintain 2018 NOPAT margins (40%) and grow NOPAT by just 4% compounded annually over the next decade, the stock is worth $32/share today – a 39% upside. See the math behind this dynamic DCF scenario.
This article originally published on April 10, 2019.
Disclosure: David Trainer, Kyle Guske II, and Sam McBride receive no compensation to write about any specific stock, sector, style, or theme.
Follow us on Twitter, Facebook, LinkedIn, and StockTwits for real-time alerts on all our research.
