We published an update on the Snap & Tesla Danger Zone picks on August 3, 2021. A copy of the associated Earnings Update report is here.
Editor’s Note on 3/23/2021
We updated this report to correct the implied user growth in Snap’s (SNAP: $54/share) valuation, the stock price when we originally published the report, after we realized that we incorrectly calculated the daily active users (DAUs) implied by the stock price based on quarterly average revenue per user (ARPU) instead of annual average revenue per user (ARPU).
After correcting this error, our thesis remains unchanged given that Snap’s valuation implies it will double ARPU while also increasing DAUs by nearly 700%, or to about half the global population.
Check out this week’s Danger Zone interview with Chuck Jaffe of Money Life.
Just as we did last year, we’re starting 2021 by looking at our worst-performing Danger Zone picks (as we recently did with our Long Ideas from 2020). The strong rise in these stocks in 2020 makes them even riskier in 2021.
Wayfair, Inc. (W: $259/share), Tesla (TSLA: $811/share), and Snap (SNAP: $54/share) are our three Danger Zone lowlights from 2020. Despite their recent momentum, we remain bearish on these stocks, and they remain open Danger Zone picks.
In 2020, our Danger Zone picks overall failed to outperform as shorts, as the market soared to record heights. Only 11 out of our 34 Danger Zone picks outperformed the market (S&P 500) as shorts.
Overall, the Danger Zone stocks, including reiterated and closed ideas, averaged a 57% return in 2020 versus the S&P 500’s 16% gain.[1] Next week, we’ll review our best Danger Zone picks from 2020.
Our Danger Zone reports combine our proprietary fundamental data, proven superior in The Journal of Financial Economics[2], with qualitative research to highlight firms whose stocks present among the worst risk/reward. Danger Zone reports show investors how to use our research and the transparency of our analytical process.
Figure 1: Performance From Each Danger Zone Publish Date Through 12/31/2020

Sources: New Constructs, LLC
Lowlight 1: Wayfair Inc. (W) – Full Year Performance: Up 150% vs. S&P 500 up 16%; Report Published March 16, 2020: Up 641% vs. S&P up 57%; Reiterated August 17, 2020: Down 28% vs. S&P up 11%
We first put Wayfair in the Danger Zone in March 2015, and we did so again in March and August of 2020. While significantly underperforming as a short since March 2020, the stock has outperformed as a short since August. We believe W continues to hold significant downside risk at its current valuation.
What Went Wrong: Our March 2020 report on Wayfaircoincided with the market bottom during the COVID-19 induced crash. Subsequent lock down orders across the country, the closing of many brick-and-mortar stores, and increased work-from-home-activity helped drive e-commerce sales to record levels. In turn, Wayfair’s revenue and stock price increased.
Why W Is Still in the Danger Zone: As noted in our August report, the COVID-19 bump in revenue will not last forever, as consumers look to get back into retail stores and return to some level of normalcy. Continued vaccine distribution should drive such behavior through 2021 as well.
Additionally, despite record e-commerce sales, Wayfair’s profitability still lags peers. Wayfair’s return on invested capital (ROIC) and net operating profit after-tax (NOPAT) margin of 0% rank well below the market-cap weighted peer group average for ROIC (18%) and NOPAT margin (6%). Peers include Amazon.com Inc. (AMZN), Walmart Inc. (WMT), The Home Depot, Inc. (HD), Lowe’s Companies, Inc. (LOW), Target Corporation (TGT), eBay Inc. (EBAY), Etsy Inc (ETSY), Williams-Sonoma Inc. (WSM), Overstock.com Inc. (OSTK), and other housewares and home furnishing firms.
Lastly, the firm was only able to “right-size” its cost structure to the point of reaching break-even. Even so, TTM total expenses remain 100% of revenue, which indicate the firm is not greatly benefiting from economies of scale while growing the top line. With such strong competition, both in person and online, Wayfair faces an uphill battle to profitability and an even harder battle to justify the expectations baked into its current stock price, as we’ll show below.
Valuation Implies Growth Well Above Consensus: When we use our reverse discounted cash flow (DCF) model to analyze the expectations implied by the stock price, Wayfair is significantly overvalued.
To justify its current price of ~$259/share, Wayfair must:
- Immediately achieve a 2% NOPAT margin (vs. 0% TTM) in 2020 and 2021 and increase NOPAT margin to 5.7% (equal to Amazon’s TTM NOPAT margin) in 2022 and each year thereafter
- Grow revenue by 27% compounded annually for the next seven years (vs. average consensus estimate of 20% over the same time).
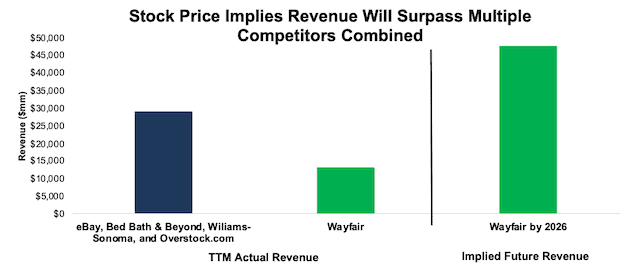
See the math behind this reverse DCF scenario. In this scenario, Wayfair’s revenue in 2026 would reach $47.7 billion, which is 54% of Target’s TTM revenue and greater than the combined TTM revenue of eBay, Bed, Bath & Beyond (BBBY), Williams-Sonoma, and Overstock.com.
Figure 2: Current Valuation Implies Massive Revenue Growth
Sources: New Constructs, LLC and company filings
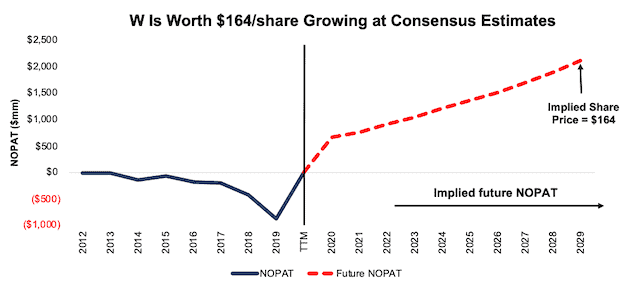
Significant Downside Even Growing at Consensus: Even if we assume Wayfair can achieve a 5% NOPAT margin (equal to five-year average of Target’s NOPAT margin) and grow revenue by 17% compounded annually (in line with average consensus estimates through 2029) for the next decade, the stock is worth only $164/share today – a 37% downside to the current stock price. See the math behind this reverse DCF scenario.
Figure 3 compares the firm’s implied future net operating profit after tax (NOPAT) in this scenario to its historical NOPAT.
Figure 3: Wayfair Has Large Downside Risk: DCF Valuation Scenario
Sources: New Constructs, LLC and company filings
Each of the above scenarios also assumes Wayfair is able to grow revenue, NOPAT, and free cash flow (FCF) without increasing working capital or fixed assets. This assumption is highly unlikely but allows us to create best-case scenarios that demonstrate how high expectations embedded in the current valuation are. For reference, Wayfair’s invested capital has increased by an average of $267 million (3% of 2019 revenue) over the past five years.
Lowlight 2: Tesla Inc. (TSLA) – Full Year Performance: Up 743% vs. S&P 500 up 16%; Report Published August 4, 2020: Up 137% vs. S&P up 14%; Reiterated November 30, 2020 and December 14, 2020
We’ve been bearish on Tesla since August of 2013. The stock has clearly gone against us since then considering the huge increase in 2020, which culminated in Tesla being added to the S&P 500 at the end of the year.
What Went Wrong: Tesla’s recent surge is unjustified, to say the least, given the many competitors that continue to enter the electric vehicle market, high cash burn, and its falling market share in the electric vehicle market globally. The stock looks more bubble-like with each passing day as the valuation is entirely disconnected from the fundamentals of the business.
As an example of the ridiculous ideas driving TSLA’s momentum, Morgan Stanley’s Adam Jonas’ recent note, which give Tesla a price target of $810/share, with $37/share alone for the firm’s insurance business. At $37/share, this insurance business would have a larger market cap than Allstate (ALL).
Why TSLA Is Still in the Danger Zone: the list of potential headwinds for Tesla, the business and the stock, is long and growing. From an operational side, the firm:
- faces heavy competition from incumbent automakers
- is losing market share across the globe
- struggles to maintain vehicle quality
- has no advantage in battery or self-driving technology.
From a technical perspective, the firm’s inclusion in the S&P 500 may exhaust the momentum and sentiment (though clearly not as of yet) that has driven the stock to record highs. However, we would caution any investor looking to short Tesla. While the stock poses significant risk for fiduciaries, it’s clear the stock could continue rising in spite of the challenges facing the firm.
Tesla Just Keeps Getting More Expensive: Despite losing its first mover advantage, competition ramping up production, and simply meeting, not exceeding, production goals in 2020, Tesla’s stock price continues to rise.
Now the expectations baked into its stock price of ~$811/share are not only overly optimistic, but nearly impossible in some cases. To justify its current valuation Tesla must:
- Immediately achieve a 7% NOPAT margin, which is above Toyota’s TTM NOPAT margin of 5%. For reference, Tesla’s TTM NOPAT margin is 2%, which is the highest in the firm’s history.
- Grow revenue by 40% compounded annually for the next 11 years
- Grow revenue, NOPAT, and FCF without increasing working capital or fixed assets – a highly unlikely assumption that creates a truly best-case scenario. For reference, Tesla’s invested capital has grown 59% compounded annually since 2010 and 36% compounded annually over the past five years.
See the math behind this reverse DCF scenario. In this scenario, Tesla would earn $1 trillion in revenue 11 years from now and the firm’s NOPAT in 2030 would equal $70.6 billion (vs. $538 million TTM). For comparison, the combined TTM revenue of Toyota (TM), Honda Motor Co. (HMC), Ford Motor Company (F), General Motors (GM), and Fiat Chrysler Automobiles (FCAU) is $726 billion. Toyota, the world’s second largest (by revenue) automobile manufacturer, generated TTM NOPAT of $13 billion, or just 18% of Tesla’s implied NOPAT in this scenario.
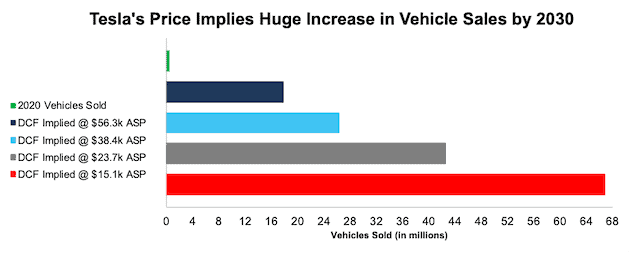
Tesla’s Valuation Implies It Will Sell the Majority of Global EVs: At its current average selling price (ASP) of ~$56k, Tesla’s current stock price implies the firm will sell 17.9 million vehicles in 2030 (up from ~500k in 2020), or 69% of expected global EV sales in 2030. Even Morgan Stanley analyst Adam Jonas, with a price target of $810/share on the stock, projects Tesla will sell just 5.2 million vehicles in 2030.
If Tesla’s ASP falls to ~$38k, or the average car price in the U.S. in July 2020, its implied sales volume in 2030 increases to 26.3 million vehicles in 2030, or 101% of projected global EV sales in 2030.
We think it highly unlikely that Tesla will ever sell such a high volume of cars at its current ASP because the luxury car market is not very large relative to the overall automobile market. Instead, investors should consider the implied vehicle sales by 2030 based on lower ASPs that are required to justify TSLA’s valuation at ~$811/share.
Figure 4: Implied Vehicle Sales in 2030 to Justify Current Price Vs. 2020 Sales
Sources: New Constructs, LLC and company filings.
Per Figure 4, Tesla’s valuation implies that, in 2030, the firm will sell:
- 26.3 million vehicles – ASP of $38k (average car price in U.S. in July 2020)
- 42.6 million vehicles – ASP of $24k (equal to Toyota)
- 66.9 million vehicles – ASP of $15k (equal to General Motors).
Below are the percentages of expected global EV sales in 2030 that those numbers of vehicles represent:
- 101% for 26.3 million vehicles
- 164% for 42.6 million vehicles
- 257% for 66.9 million vehicles.
In other words, even if you believe Tesla can maximize production, effectively cut costs, and introduce mass-market vehicles at an ASP equal to the U.S average, the firm must take 101% of the expected EV market to justify its current stock price. Anything less means the stock is overvalued.
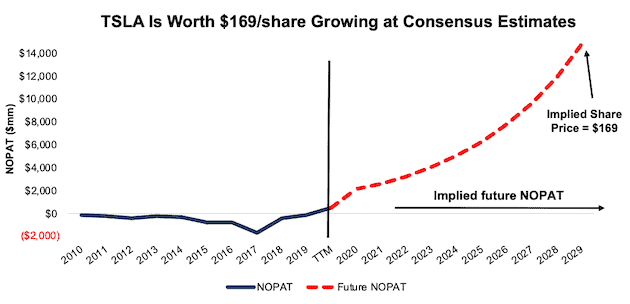
Valuation Is Ridiculous Even Compared to Consensus Growth Expectations: Even if we assume Tesla can achieve a 7% NOPAT margin and grow revenue by 24% compounded annually (in line with consensus estimates through 2025) for the next decade, the stock is worth only $169/share today – a 79% downside to the current stock price. See the math behind this reverse DCF scenario.
Figure 5 compares the firm’s implied future NOPAT in this scenario to its historical NOPAT. This scenario implies Tesla’s NOPAT 10 years from now will be nearly $15 billion, or 15% higher than Toyota’s TTM NOPAT.
Figure 5: Tesla Has Large Downside Risk: DCF Valuation Scenario
Sources: New Constructs, LLC and company filings.
Given the above, it’s clear to see just how much risk investors take by owning Tesla at current prices. The overvalued stock price, along with its weakening competitive position, led us to name it one of the Most Dangerous Stocks for Fiduciaries Heading Into 2021.
Huge Downside in A More Likely Scenario
We think it is likely that Tesla never generates more than $5 billion in NOPAT, which gives it a fundamental value ~$55/share. Our most likely scenario is that investors wake up to Tesla’s competitive disadvantages and knock the stock down to $80-90/share where a white knight buyer might scoop it up.
Lowlight 3: Snap Inc. (SNAP) – Full Year Performance: Up 206% vs. S&P 500 up 16%; Report Published September 14, 2020: Up 108% vs. S&P up 11%
We first put Snap in the Danger Zone in February 2017 prior to its IPO and closed the position in February 2019 after the stock fell 65% from its IPO day closing price. We put the stock back in the Danger Zone in September 2020 given that at the time it traded over 150% higher than when we closed the position, despite no real improvement in the fundamentals of the business.
What Went Wrong: We overestimated the market’s want/ability to rationally invest in high-flying, yet unprofitable, tech firms. Instead, the market focused on user growth and ignored the headwinds facing Snap’s business, especially cash flows. As competition for ad dollars continues to heat up, we believe it is increasingly unlikely that Snap is able to justify the cash flow expectations baked into its stock price.
Why SNAP Is Still in the Danger Zone: Snap remains especially risky for fiduciaries, given that:
- daily active users (DAUs) growth still comes from its least profitable markets
- competitors continually copy Snap’s features
- the firm’s expenses remain well above revenue and are unlikely to subside
- the stock price implies Snap’s DAUs will be nearly half the world assuming it maintains its current average revenue per user (ARPU).
Snap reported a 19% YoY increase in DAUs in 3Q20. However, much of this growth came from the “Rest of World” segment (+43% YoY) rather than the United States (+7% YoY) and Europe (+11% YoY). As we’ve pointed out in our original report, the “Rest of World” segment is much less profitable than the United States and Europe. In 3Q20 the Rest of World segment generated less than one-fifth the average revenue per user (ARPU) as the United States, and just two-thirds the ARPU as Europe.
Snap also faces headwinds from deep-pocketed competitors that can easily and quickly copy its key offerings, per Instagram’s success with its Stories feature. More recently, Twitter added a “disappearing-content” feature, called Fleets. We do not see much of a moat around Snap’s business.
Lastly, and similar to Wayfair above, Snap has been unable to reign in its costs in a way that would meaningfully create a path to profitability. Over the TTM, Snap’s cost of revenue, sales & marketing, general & administrative, and research & development costs (Total Costs & Expenses) are 147% of revenue. In 3Q20 alone, when the company reported record revenue, Total Costs & Expenses were still 125% of revenue. To maintain competitiveness, attract new users, and develop new products to engage those users, Snap must continue this spending, which makes us question whether it can ever achieve profitability.
Valuation Implies Growth Well Above Consensus: When we use our reverse DCF to analyze the expectations implied by the stock price, Snap is significantly overvalued.
To justify its current price of ~$54/share, Snap must:
- Immediately improve its NOPAT margin to 16% (compared to -45% TTM), which equals Twitter’s best-ever margin in 2018
- Grow revenue by 34% compounded annually for the next ten years (vs. average consensus estimate of 21% over the same time).
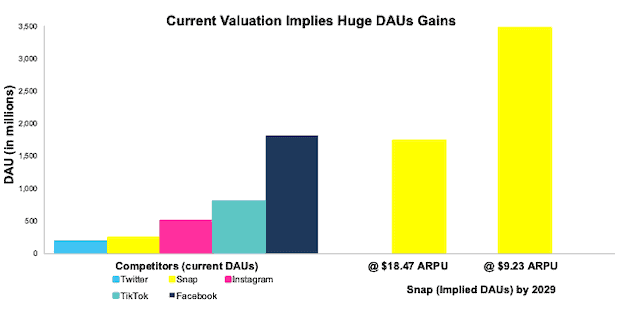
See the math behind this reverse DCF scenario. In this scenario, Snap would generate $32 billion in revenue ten years from now, compared to $2.2 billion TTM. At its annual ARPU[3], $9.23 at the end of 3Q20, this scenario implies the firm would have nearly 3.5 billion DAUs, which equals ~44% of the global population, and nearly two times Facebook’s 3Q20 DAUs.
For comparison, if we optimistically assume Snap can immediately double ARPU to $18.47, then Snap needs just over 1.7 billion DAUs to achieve the revenue implied by its stock price.
In other words, even if Snap can double ARPU, it must have 95% of the DAUs (ten years from now) of Facebook in 3Q20 to justify its current stock price.
Figure 6 compares the DAUs implied by Snap’s stock price to some of its largest competitors. At its current ARPU, Snap’s stock price implies it will have more DAUs (in 10 years) than Facebook, TikTok, Instagram, or Twitter, currently have.
Figure 6: Snap’s Valuation Implies DAUs Will Dwarf Competition
Sources: New Constructs, LLC and company filings.
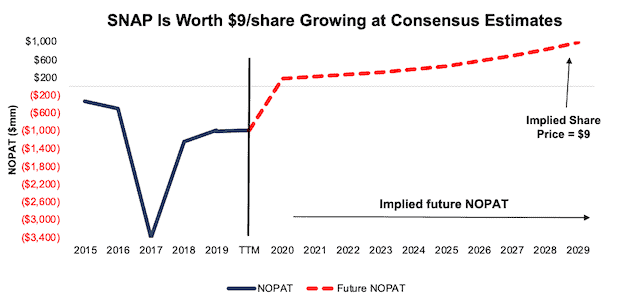
Significant Downside Even Growing at Consensus: Even if we assume Snap can achieve a 9% NOPAT margin (equal to Twitter’s average margin over the past three years) and grow revenue by 21% compounded annually (in line with average consensus estimates through 2029) for the next decade, the stock is worth only $9/share today – an 83% downside to the current stock price. See the math behind this reverse DCF scenario.
Figure 7 compares the firm’s implied future NOPAT in this scenario to its historical NOPAT.
Figure 7: Snap Has Large Downside Risk: DCF Valuation Scenario
Sources: New Constructs, LLC and company filings.
Each of the above scenarios also assumes Snap is able to grow revenue, NOPAT, and free cash flow (FCF) without increasing working capital or fixed assets. This assumption is highly unlikely but allows us to create best-case scenarios that demonstrate how high expectations embedded in the current valuation are. For reference, Snap’s invested capital has increased by an average of $643 million (30% of TTM revenue) over the past four years.
This article originally published on January 11, 2021.
Disclosure: David Trainer, Kyle Guske II, and Matt Shuler receive no compensation to write about any specific stock, sector, style, or theme.
Follow us on Twitter, Facebook, LinkedIn, and StockTwits for real-time alerts on all our research.
[1] The S&P 500 gained 16% in 2020, but since our picks are published over the course of the year, we measure performance of our picks against the S&P 500 at the publication dates, not the beginning of the year.
[2] Our reports utilize our Core Earnings, a superior measure of profits, as demonstrated in Core Earnings: New Data & Evidence, a paper by professors at Harvard Business School (HBS) & MIT Sloan. Recently accepted by the Journal of Financial Economics, the paper proves that our data is superior to all the metrics offered elsewhere.
[3] Calculated as TTM revenue of $2.2 billion divided by average quarterly DAUs over the TTM (234 million).
