We published an update on SYY on Nov 18, 2021. A copy of the associated Earnings Update report is here.
With analysts warning the S&P 500 is alarmingly high and social-media-driven trading mobs driving stocks like GameStop (GME) to dizzying heights, we’re proposing investors focus more on stocks with quality fundamentals.
We pair this week’s Long Idea, Sysco Corporation (SYY: $74/share), with a sell idea, DoorDash (DASH: $198/share) as we revisit our micro-bubble winners and losers theme.
“Micro-Bubbles” are groups of stocks with extraordinary risk compared to other stocks within the overall market. In August 2018 and September 2018, we highlighted six micro-bubble loser stocks along with six micro-bubble winners. Micro-bubble winners are undervalued stocks of companies positioned to excel during and after the stocks in micro-bubbles burst.
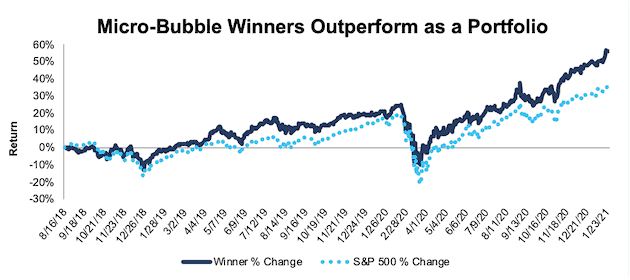
Micro-Bubble Winners Outperformed the S&P 500
While not all micro-bubble winners outperformed micro-bubble stocks, the micro-bubble winners have returned 56% and outperformed the S&P 500 (up 36%) by 20% from the date of publication. Going forward, we believe micro-bubble winners will not only continue to outperform the market, but also the micro-bubble stocks as investors realize the high level of risk in owning them.
Figure 1: Micro-Bubble Winners Performance vs. S&P 500

Sources: New Constructs, LLC and company filings.
S&P 500 Is Expensive, but There’s Still Value in the Market
We agree with market pundits that the valuation of the S&P 500 is over its skis. On a price-to-Core Earnings[1] basis, the S&P 500 is at all-time highs. However, investors should not paint all stocks with the same brush because there are pockets of undervalued stocks. The sky-high valuations of micro-bubble stocks are so out of line that they disproportionately impact the valuation of the overall market.
For example, many of the micro-bubble stocks have valuations that require their firms win more than 100% of their total addressable markets (TAM). On the other hand, the micro-bubble winners are firms with large, established and growing market share and high margins with stock valuations that imply market share declines. The difference in risk/reward for many of the micro-bubble winners versus losers has grown absurdly large.
Micro-Bubble Winners vs. Micro-Bubble Losers
Since shorting stocks can be expensive and difficult, this report presents a list of long ideas of stocks that should rise even when micro-bubble stocks fall. Figure 2 pairs our micro-bubble winners and their micro-bubble loser.
Figure 2: Micro-Bubble Winners & Micro-Bubble Stocks

Sources: New Constructs, LLC and company filings.
*New to the list as of this report.
New Micro-Bubble Winner: Sysco (SYY) vs. New Micro-Bubble Loser: DoorDash (DASH)
As our Most Ridiculous IPO of 2020, DoorDash, Inc. (DASH) is a perfect example of a micro-bubble stock. Despite a super-hyped IPO and being up 39% year-to-date (YTD), DoorDash’s business is poor.
Despite the surge of demand for food delivery during the pandemic, DoorDash was unable to achieve meaningful profitability during that time. If the firm cannot make profits with record demand, one must wonder if it ever can.
DoorDash’s entire business model is built on the faulty assumption that it can profitably defend its market position after it wins significant market share. DoorDash currently has ~16% of its TAM, but its current valuation (using the same assumptions as our Danger Zone report here) implies the firm will generate $59.4 billion in revenue in 2030. At its TTM take rate, this scenario equates to ~$514 billion in marketplace gross order volume for DoorDash in 2030. For reference, UBS estimates the global food delivery market will be worth $365 billion in 2030, which means the market expects DoorDash to take 141% of its TAM by 2030. See the math behind this reverse DCF scenario.
With very low switching costs (if any) and high-risk of substitutes from restaurants who can easily deliver food themselves, we do not expect food delivery will ever be a profitable business.
While investors may not want to get in front of the momentum train by shorting a stock like DASH, we recommend they prepare their portfolios for the eventuality that the momentum driving up stocks like DASH will eventually run out.
Meanwhile, investors should consider where they can find good value in the food industry with individual stocks such as Sysco Corporation (SYY). Unlike DoorDash, Sysco actually has a competitive advantage that is difficult for competitors to replicate – economies of scale.
Sysco’s revenue over the TTM of $49.4 billion is nearly equal to the combined revenue of its two largest competitors US Foods (USFD) and Performance Food Group Co. (PFGC). This scale helps Sysco achieve a higher net operating profit after tax (NOPAT) margin and return on invested capital (ROIC) than its competitors.
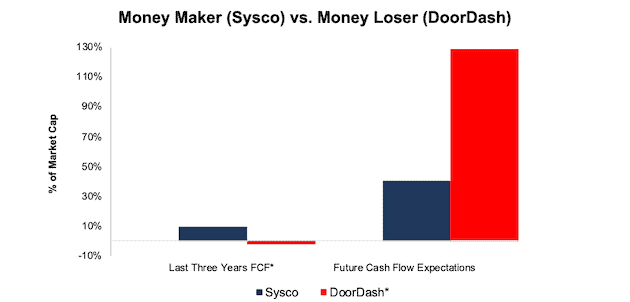
A Disconnect in Market Expectations: Figure 3 shows the current free cash flow (FCF) and the future cash flow expectations[2] for Sysco and DoorDash as a percent of market cap. Despite having worse cash flow than Sysco, DoorDash’s stock price reflects expectations for future cash flows that are drastically higher than the expectations implied by Sysco’s valuation.
Figure 3: Sysco vs. DoorDash: Growth Expectations vs. Historical Cash Flows

Sources: New Constructs, LLC and company filings.
*A 3-year FCF value is not available for DoorDash since it is a recent IPO. The FCF shown is from 2020, the only available period in our model.
Even though Sysco’s NOPAT fell 52% YoY in 2020 due to the extreme market conditions in the food service industry, we believe the firm’s profits will return to pre-pandemic levels once the food service industry recovers. This initial decline is the “dip” that we explain in our “See Through the Dip” thesis.
Beyond expectations for future growth, Sysco is also more attractive than DoorDash in many key fundamental metrics, per Figure 4. Despite facing huge headwinds while DoorDash enjoyed huge tailwinds in 2020, Sysco’s fundamentals and valuation offer staggeringly better risk/reward.
Figure 4: Sysco vs. DoorDash Fundamental Metrics Comparison

Sources: New Constructs, LLC and company filings.
General Motors Is the Micro-Bubble Winner When the Tesla Bubble Bursts
While we still like each of the micro-bubble winners from Figure 2, we especially want to highlight the differences in fundamentals and expectations for General Motors (GM) and Tesla (TSLA), one of the most dangerous stocks entering 2021.
Tesla has long benefited from its first mover status in the electric vehicle market, but the competitive advantages it once held are diminishing. The firm’s earnings miss tonight could signal the beginning of the end for this over-hyped stock.
With ambitious plans to scale its operations, Tesla has yet to overcome its biggest hurdle – increasing its manufacturing capacity to meet its planned production. Tesla is already seeing a loss in market share in Europe, where three incumbents outsold Tesla in EV sales in 3Q20, which we see as a sign of things to come globally.
While Tesla is focused on building factories, tech companies such as Apple (AAPL) are leaving the production to the incumbents and focusing purely on higher-margin battery and automated vehicle (AV) technology.
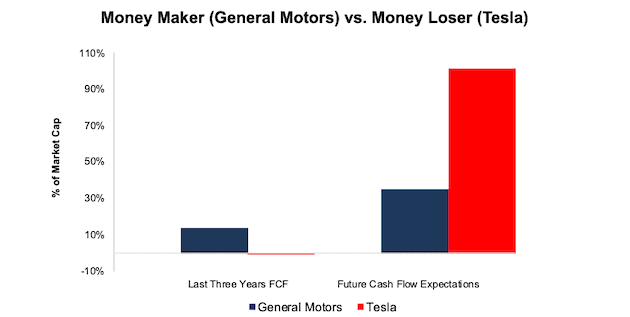
Unlike Tesla, General Motors has an existing cash-generating business to fund EV research and development. Over the past three years, General Motors generated $10.6 billion (14% of market cap) of FCF. For comparison, Tesla burned through $6.7 billion over the past three years.
While the firm plans to invest $27 billion in EV and AV over the next five years, it can leverage its existing manufacturing capacity to produce millions of EVs, far more than Tesla may ever produce. General Motors is better positioned to focus on advancing EV technology while Tesla is bogged down with building factories.
General Motors’ fast-follower EV strategy could prove far more successful than Tesla’s over-hyped first-mover strategy. In the third quarter alone in China, General Motors’ new EV outsold Tesla’s Model 3. Going forward, the firm’s production operations will be ready to handle the 30 new EV models it plans to introduce by 2025.
A Disconnect in Market Expectations: Despite General Motors’ recent success, Tesla’s stock price still reflects expectations for future cash flows that are drastically higher than the expectations implied by General Motors’ valuation.
Figure 5 shows the difference between the last three years of FCF and the expectations for General Motors and Tesla’s future cash flow as a percent of market cap.
Figure 5: General Motors vs. Tesla: Growth Expectations vs. Historical Cash Flows

Sources: New Constructs, LLC and company filings.
Figure 6 shows that General Motors’ superior NOPAT Margin over the trailing twelve months (TTM) drives its ROIC higher than Tesla’s.
Figure 6: General Motors vs. Tesla Fundamental Metrics Comparison

Sources: New Constructs, LLC and company filings.
Keep These Winners & Sell These Losers
When we remove the 1,216% gain Tesla’s stock has made since August 2018, we find the remaining five micro-bubble winners have outperformed the remaining micro-bubble losers. As a portfolio, the remaining five micro-bubble winners (DIS, ORCL, WMT, GOOGL, MSFT) are up 58% and have outperformed the remaining five micro-bubble losers (NFLX, CRM, AMZN, GDDY, DBX) (up 37%) by 21% since our original Micro-Bubble winner/loser reports.
We believe the micro-bubble winners will continue to outperform the micro-bubble stocks going forward, especially because the expectations implied by the micro-bubble winner’s valuations are much less than those of the micro-bubble stocks.
This article originally published on January 27, 2021.
Disclosure: David Trainer, Kyle Guske II, and Matt Shuler receive no compensation to write about any specific stock, style, or theme.
Follow us on Twitter, Facebook, LinkedIn, and StockTwits for real-time alerts on all our research.
[1] Core Earnings are a superior measure of profits, as demonstrated in Core Earnings: New Data & Evidence, a paper by professors at Harvard Business School (HBS) & MIT Sloan. Recently accepted by the Journal of Financial Economics, the paper proves that our data is superior to all the metrics offered elsewhere.
[2] Future cash flow expectations (aka “PVGO”) throughout this report equal the incremental present value of growth in future cash flows required to justify a stock price. The calculation is market value minus economic book value. For Sysco, we calculate economic book value using a 3-year average NOPAT to represent a conservative level of profit recovery from current levels, which we believe are temporarily low due to pandemic-related effects to each business.
