We published an update on GOOGL on May 11, 2022. A copy of the associated Earnings Update report is here.
We published an update on SKX on May 4, 2022. A copy of the associated Earnings Update report is here.
We published an update on INTC on February 9, 2022. A copy of the associated Earnings Update report is here.
Last week, we reiterated three Long Ideas that recently reported calendar 1Q21 earnings. This week, we’re reiterating three more: Alphabet, Inc (GOOGL: $2,291/share), Intel Corporation (INTC: $58/share), and Skechers USA, Inc. (SKX: $49/share).
Still Undervalued
Figure 1 shows the performance of the three Long Ideas featured in this report since the publication of our first Long Idea report on them. We leverage more reliable fundamental data, proven in The Journal of Financial Economics[1], with qualitative research to highlight these firms whose stocks present excellent risk/reward.
Figure 1: Long Idea Performance: From Date of Publication Through 4/27/2021
Sources: New Constructs, LLC
*Measured from the date of publication of each respective original report. Dates can be seen in each company section below. Performance represents price performance and is not adjusted for dividends.
Alphabet: More Upside at Current Price
We made Alphabet a Long Idea in Feb 2018, and we’re reviewing what’s worked, what hasn’t worked and why we still like this stock.
What’s Working: Despite companies reducing their overall advertising budgets during the pandemic, rising U.S. ecommerce sales drove a 12% YoY increase in digital advertising spending. Going forward, the accelerated shift to ecommerce (U.S. sales +44% year-over-year in 2020) presents a large opportunity for Alphabet to expand its already formidable online ad business.
Alphabet generated 80% of its 2020 revenue from online ads, which is down from 88% in 2016. The firm has developed other business lines through cloud services, subscriptions, and hardware which reduce its dependence on ad revenue and help drive more revenue growth. Alphabet’s non-online ad revenue grew from $10.8 billion in 2016 to $36.5 billion in 2020, or 28% compounded annually, which outpaces its total revenue compounded annual growth rate of 18% over the same time.
Alphabet’s legacy advertising business drives the firm’s significant free cash flow (FCF) generation. Over the past five years, Alphabet has generated more FCF ($98.2 billion or 6% of market cap) than all but two firms in the S&P 500: Apple (AAPL) and JPMorgan Chase (JPM). Alphabet’s strong FCF enables it to invest in new technologies to keep revenue growth stronger for longer.
One such investment, Waymo and its self-driving technology, could be the next large cash-generating business for the firm. Waymo already has partnerships with leading auto manufacturers Fiat Chrysler, Jaguar, Nissan, Renault, Volvo, and Magna. By focusing on developing software and not manufacturing vehicles, Alphabet is positioned to continue generating high ROIC and creating more shareholder value in a traditionally capital-intensive industry.
What’s Not Working: Apple’s iOS14 privacy update threatens firms such as Facebook (FB) and Alphabet that utilize data to provide highly targeted advertising services. However, online advertising, which currently accounts for 54% of all advertising spending, even with limited amounts of data, will still provide the most targeted, large-scale advertising approach available, and companies will continue directing advertising dollars to online ads. Alphabet is further insulated from Apple’s iOS14 update as the majority of the firm’s ad revenue comes from search result pages that are keyword-driven.
Antitrust and regulatory threats to Alphabet are longstanding and should not be ignored. However, regulators, so far, have preferred to fine specific violations rather than seek a wholesale reorganization of the business.
While it remains the largest U.S. online advertiser, Alphabet is losing market share to Facebook and Amazon (AMZN). Alphabet’s share of its U.S. total addressable market (TAM) fell from 31.6% in 2019 to 28.9% in 2020 while Amazon’s improved from 7.8% to 10.3% over the same time. Specifically, Amazon’s ad revenue growth is driven by ecommerce search revenue. As more companies develop more sophisticated ecommerce platforms that customers can directly access apart from Google search, Alphabet could see its market share continue to decline. However, the market remains plenty big enough to accommodate more than one ad platform, with a market size of over $152 billion in 2020.
Current Price Looks Undervalued: Below, we use our reverse discounted cash flow (DCF) model to analyze the expectations for future growth in cash flows baked into Alphabet’s current stock price.
In this scenario, we assume Alphabet’s:
- NOPAT margin immediately falls to 19% (equal to 2020 and six-year low) in 2021 and remains unchanged through 2030, and
- revenue grows by 10% (vs. consensus estimate CAGR of 18% from 2021 to 2024) compounded annually through 2030.
In this scenario, Alphabet’s net operating profit after-tax (NOPAT) grows by 10% compounded annually over the next decade and the stock is worth $2,308/share today – nearly equal to the current price. See the math behind this reverse DCF scenario. For reference, Alphabet grew NOPAT by 17% compounded annually over the past five years.
There’s 26%+ Upside: If we assume:
- Alphabet’s NOPAT margin immediately falls to 19% (equal to 2020 and six-year low) in 2021 and remains unchanged through 2030, and
- revenue grows by 18% (equal to consensus estimate CAGR from 2021 to 2024) compounded annually from 2021 to 2024, and
- revenue grows by 9% compounded annually from 2025-2030 (compared to 19% CAGR from 2015 to 2020) then,
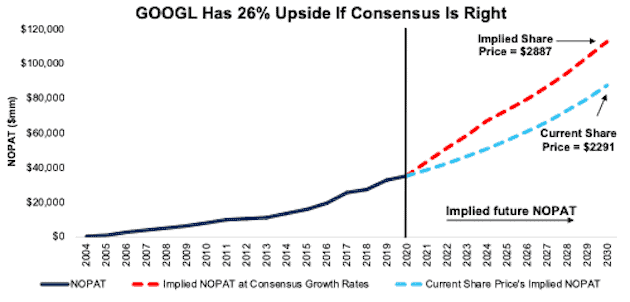
the stock is worth $2,887/share today, or 26% above the current price. See the math behind this reverse DCF scenario.
In this scenario, Alphabet’s NOPAT grows just 12% compounded annually over the next decade.
Figure 2: Alphabet’s Historical and Implied NOPAT: DCF Valuation Scenarios
Sources: New Constructs, LLC and company filings
Intel Is Positioned for Long-term Growth, but Priced for Profit Decline
We made Intel a Long Idea in August 2020. Here’s what we learned from 1Q21 earnings and, despite the stock’s underperformance since our original article, why the stock still provides quality risk/reward.
What’s Working: Our original thesis stated that while disappointing, Intel’s delay of its 7nm chips was a manufacturing problem that was solvable over the long term. Since then, Intel has brought on a new CEO, addressed the 7nm problems, and now expects its 7nm chips to come online in 2023.
Increasing geopolitical tensions between China and Taiwan may create greater demand for chip suppliers outside of those countries. Widespread perception of China’s involvement in IP theft, along with China’s increased involvement within Taiwan is likely to lead customers to source chips elsewhere. In 2020, Taiwan Semiconductor Manufacturing Company (TSM) accounted for 54% of global foundry revenue. While Taiwan Semiconductor Manufacturing is opening a $12 billion foundry in Arizona, Intel is already uniquely positioned, with most of its manufacturing in the U.S. and Europe, to meet the demands of chip customers, especially governments, seeking to source their supply chains outside of China-influenced areas.
Intel announced in March that it plans to invest $20 billion to develop two new foundries in Arizona that will contract out its manufacturing capabilities to chip designers. Establishing foundries allows the firm to further monetize its decades-long manufacturing expertise beyond its own chips. As Intel expands to manufacture outside chips, it will gain even more expertise to improve its manufacturing processes as it did with its 7nm chip rollout.
Intel’s strong FCF fortifies its market position. Over the past five years, Intel generated $42.2 billion (18% of market cap) in FCF. Strong FCF gives the firm flexibility to invest in various businesses to secure future revenue growth opportunities, such as Habana, which produces high-end AI processors, and Mobileye, which develops self-driving and driver assistance systems.
While several firms, including Alphabet, are developing self-driving technology, Mobileye is well-positioned as a pick-and-shovel provider of equipment needed to power self-driving multiple technologies. In 2020, Mobileye shipped over 17 million systems (cameras, software, and chips) to enable advanced driving systems within the auto manufacturing industry.
What’s Not Working: AMD expects its 5nm chip (which is comparable to Intel’s 7nm chip) to start production in 2022, which is before Intel’s expected launch of its 7nm chips in 2023. With a technological edge over Intel, AMD could continue to take market share.
Furthermore, even though a growing number of customers may seek national security and production diversification, it remains to be seen if designers will be willing to trust their IP with a competitor like Intel. However, we think many companies see the risk of operating in countries that do not support their IP rights as higher than trusting firms to respect those rights in countries where they have legal recourse.
Intel shares also fell 7% on the news that its highly lucrative Data Center segment’s sales were down 20% year-over-year. While Intel’s management suggests this is a temporary problem caused by customers working through excess inventory, the news that AMD’s data business more than doubled YoY in 1Q21 suggests otherwise. AMD is making large inroads within a segment Intel has reliably dominated and Intel’s recently rolled out 10nm Ice Lake chip may not be enough to slow down AMD’s market share growth. For reference, in 4Q20, Intel’s share of its Data Center TAM was 92%.
Longer term, Intel faces newer threats from Amazon, Alphabet, and Apple (AAPL). While Apple accounted for 2% to 3% of Intel’s 2020 revenue, Intel’s exposure to Amazon and Alphabet is much less, with both firms accounting for a combined 1% of Intel’s revenue in 2019. Though these firms may no longer rely on Intel chips, Intel could provide third-party foundry manufacturing for these chip designers going forward. As Intel’s CEO Pat Gelsinger put it, “We’ll also pursue customers like Apple and say, ‘Boy, you know, is it possible to build and expand on your foundry capabilities as well?’”
Current Price Has Upside Even If Profits Never Grow: Intel’s price-to-economic book value (PEBV) ratio is 0.7. This ratio implies that the market expects Intel’s profits to permanently decline by 30%.
Below, we use our reverse DCF model to analyze the expectations for future growth in cash flows baked into INTC’s current price.
In this scenario, we assume:
- Intel’s NOPAT margin immediately falls to 24.9% (which is the firm’s five-year average compared to 26% in 2020) in 2021 and remains unchanged through 2030 and
- revenue falls by 6% (consensus estimate) in 2021 and falls by 5% (compared to average consensus estimate of +2% from 2022 to 2023) compounded annually from 2022 to 2030.
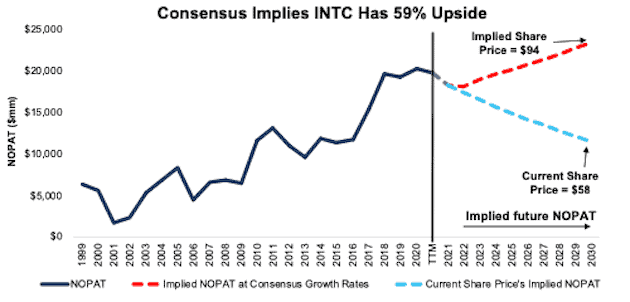
In this scenario, Intel’s NOPAT falls 5% compounded annually over the next decade and the stock is worth $59/share today – nearly equal to the current price. See the math behind this reverse DCF scenario. Intel’s 2030 NOPAT in this scenario is 43% below its 2020 NOPAT. For reference, Intel has grown NOPAT by 12% compounded annually over the past five years.
$94/Share If Consensus Is Right: If we assume:
- Intel’s NOPAT margin immediately falls to 24.9% in 2021 and remains unchanged through 2030 and
- revenue falls by <1% (equal to consensus estimates) compounded annually from 2021 to 2023 and
- revenue grows by 3% compounded annually each year thereafter through 2030, which is below the average annual global GDP growth rate of 3.5% since 1961, then
the stock is worth $94/share today, or 59% above the current price. See the math behind this reverse DCF scenario. In this scenario, Intel’s NOPAT grows just 1.5% compounded annually over the next decade. For reference, Intel grew NOPAT by 6% compounded annually over the past 10 years.
Figure 3: Intel’s Historical and Implied NOPAT: DCF Valuation Scenarios
Sources: New Constructs, LLC and company filings
Skechers Has Lots of Upside
We made Skechers a Long Idea in May 2018 and reiterated it in Sep 2019. Below, we show what we learned from 1Q21 earnings and why SKX remains a Long Idea.
What’s Working: Skechers has built a niche market focusing on overlooked demographics such as seniors and women. The firm targets these demographics with comfortable and affordable footwear and lower-cost advertising strategies that don’t rely on expensive sponsorships.
Skechers’ retail and international wholesale business, which has grown from 66% of total revenue in 2016 to 75% in 2020, is key to its revenue growth. Skechers’ retail business relies heavily on its company- and third-party-owned brick-and-mortar stores which, as of 1Q21, total 3,989 stores globally, up from 2,346 stores at the end of 2016.
Future growth for Skechers’ retail business depends in large part on the firm’s ability to continue to expand its omni-channel offerings. While many of these stores faced operational challenges due to the pandemic, Skechers saw a 212% increase in domestic ecommerce sales in 2020. Going forward, Skechers’ investments in its distribution centers and ecommerce technology, which totaled $59 million in 1Q21, will create an improved omni-channel presence.
Apart from ecommerce, overall sales are recovering, and the firm achieved record first quarter sales of $1.4 billion in 1Q21 – a 15% improvement from 1Q20. The firm’s retail sales grew even faster at 18% YoY in 1Q21 and are 13% above 1Q19.
What’s Not Working: Domestic wholesale sales fell from $1.2 billion in 2016 to $1.1 billion in 2020 and will continue to be a drag on the company’s growth going forward.
Skechers’ share of its global TAM fell from 2.6% in 2019 to 2.2% in 2020 as other brands fared better in 2020 than Skechers. While Skechers’ revenue fell 12% YoY, Nike’s (NKE) revenue fell only 4% YoY and Puma’s (PMMAF) fell 5%.
Long-term, if Skechers does rebound from 2020 revenue levels and take additional market share, larger firms such as Nike or Adidas (ADDYY) may take notice and commit more resources towards Skechers’ markets, which could put additional competitive pressure on the firm. However, that scenario is already priced into the current stock price, as we’ll show below.
Current Price Still Leaves Upside: Below, we use our reverse DCF model to analyze the expectations for future growth in cash flows baked into Skechers’ current share price.
In this scenario, we assume Skechers’:
- NOPAT margin rebounds to 9% (average from 2015 to 2019) in 2021 and remains unchanged through 2030, and
- grows revenue by just 1.5% (vs. consensus revenue estimate CAGR of +15% through 2023) compounded annually for the next decade
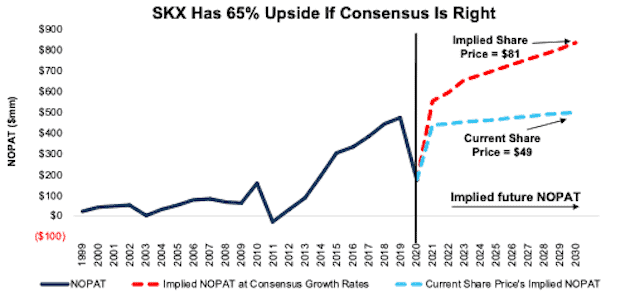
In this scenario, Skechers’ NOPAT grows by less than 1% compounded annually from 2019 to 2030 and the stock is worth $50/share today – nearly equal to the current price. See the math behind this reverse DCF scenario. For reference, before the pandemic, Skechers grew NOPAT by 23% compounded annually from 2009 to 2019.
$81/Share Looks More Likely: If we assume Skechers’:
- NOPAT margin rebounds to 9% (average from 2015 to 2019) in 2021 and remains unchanged through 2030, and
- grows revenue by 15% (equal to consensus revenue estimates) compounded annually from 2021 to 2023 and
- grows revenue by 3.5% each year thereafter through 2030, which is equal the average annual global GDP growth rate since 1961, then
the stock is worth $81/share today – 65% above the current price. See the math behind this reverse DCF scenario.
Figure 4: Skechers’ Historical and Implied NOPAT: DCF Valuation Scenarios
Sources: New Constructs, LLC and company filings
Other Stocks We Still Love
Figure 5 shows seven other Long Ideas that have recently reported their calendar 1Q21 earnings along with their relative performance to the S&P 500. Each of these Long Ideas still presents quality risk/reward.
Figure 5: More Long Ideas That Recently Reported Earnings: Through 4/27/2021
| Company | Ticker | Date Published | Earnings Date | Out (under)performance vs. S&P 500* |
| Southwest Airlines Company | LUV | 5/4/2020 | 4/22/2021 | 126% |
| D.R. Horton | DHI | 4/27/2020 | 4/22/2021 | 93% |
| HCA Healthcare | HCA | 6/22/2020 | 4/22/2021 | 70% |
| NVR Inc. | NVR | 4/17/2017 | 4/21/2021 | 51% |
| Universal Health Services | UHS | 7/22/2020 | 4/26/2021 | 10% |
| Discover Financial Services | DFS | 10/9/2019 | 4/21/2021 | -4% |
| Verizon Communications | VZ | 10/21/2021 | 4/21/2021 | -22% |
Sources: New Constructs, LLC
* Measured from the date of publication of each respective report. Performance represents price performance and is not adjusted for dividends.
This article originally published on April 28, 2021.
Disclosure: David Trainer owns LUV, DHI, and HCA. David Trainer, Kyle Guske II, and Matt Shuler receive no compensation to write about any specific stock, sector, style, or theme.
Follow us on Twitter, Facebook, LinkedIn, and StockTwits for real-time alerts on all our research.
[1] Our reports utilize our Core Earnings, a more reliable measure of profits, as demonstrated in Core Earnings: New Data & Evidence, a paper by professors at Harvard Business School (HBS) & MIT Sloan. Recently accepted by the Journal of Financial Economics, the paper proves that our data is superior to all the metrics offered elsewhere.


