We published an update on SQSP on March 14, 2022. A copy of the associated update report is here.
Squarespace (SQSP: $10 billion expected valuation) is expected to go public via direct listing on May 19, 2021. At a $10 billion valuation, based on the company’s last funding round in March 2021, Squarespace earns our Very Unattractive rating.
We think Squarespace stock is worth at best $4.2 billion, or 58% lower than its expected $10 billion valuation.
A $10 billion valuation implies Squarespace’s profits will be nearly double Etsy’s (ETSY) and five times Shopify’s (SHOP) profits. It also implies that Squarespace’s market share, as measured by revenue, would rise from 9% in 2020 to 20% in 2030.
We think the chances of the company meeting the extreme profit expectations baked into its expected valuation are very low because of the commoditization of the website building industry and availability of free substitutes.
Offering small and medium-sized businesses the ability to create a website and sell products online is valuable to users, but this market is already crowded with competitors who provide heavily discounted or free services.
Squarespace is losing money and may never turn a profit. Insiders need this direct listing more than investors.
Despite this being a “public offering”, the CEO will retain 68% of voting control so investors get neither earnings nor much of a say on corporate governance by owning this stock. This direct listing looks like a bad to deal to us, and we would not be buyers of this stock at anywhere close to the expected valuation.
Our IPO research aims to provide investors with more reliable fundamental research.
Revenue Growth and Growing Losses
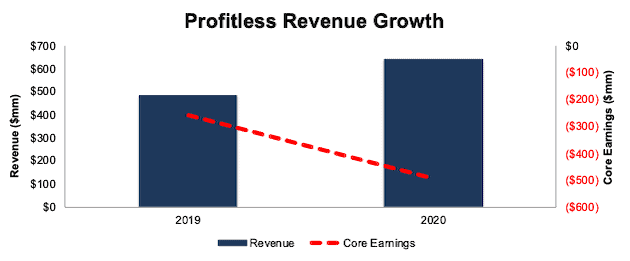
By providing the tools to conduct business online, Squarespace benefited from COVID-19’s disruption to our everyday lives. However, despite growing revenue 33% year-over-year (YoY) in 2020, profits remain elusive.
Core Earnings[1] fell from -$257 million in 2019 to -$493 million in 2020. The firm’s Core Earnings margin fell from -53% to -76% while return on invested capital (ROIC) fell from 45% to -149% over the same time.
Figure 1: Squarespace’s Revenue & Core Earnings: 2019-2020
Sources: New Constructs, LLC and company filings
Large Total Addressable Market (TAM) Entices Investors
Squarespace notes in its S-1 that as of 2019, there were ~800 million small-to-medium sized business and self-employed ventures worldwide, each of which could be a potential customer. Meanwhile, Squarespace had just 3.8 million unique subscriptions at the end of March 2021.
The company also estimates its near and medium-term TAM is “in excess of $150 billion”. Third-party analysis estimates the Web Content Management market will be worth ~$38 billion in 2030, which is obviously much lower, but still nearly 60x larger than Squarespace’s revenue in 2020.
Such a large opportunity may entice growth investors, but buyer beware. A big TAM does not mean big profits. Given the competitive landscape of the industry, we see little room for Squarespace to generate profits or come close to achieving the future profits implied by its expected valuation.
Site Building & E-Commerce Capabilities Are a Commodity
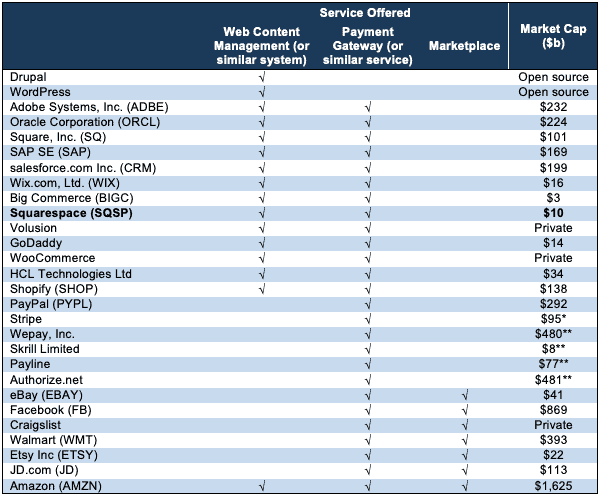
Providing the tools to build websites and sell products online may sound like a lucrative business. However, in reality, these offerings are far from unique and have been commoditized by upstarts and incumbents alike. For instance, Squarespace competes with standalone and integrated firms offering:
- Web Content Management – a system that allows users to easily create their own websites and administer website content with little programming knowledge (e.g. WordPress)
- Payment Gateway – a service that allows merchants to securely accept credit card payments
- Marketplace – an online platform to sell products and/or services from multiple third parties
Figure 2 lists many of the firms competing with Squarespace.
Figure 2: Site Building & E-Commerce Industry Is Filled with Competition
Sources: New Constructs, LLC
*Based on last funding round in March 2021
**Based on parent company’s valuation: Wepay owned by JPMorgan & Chase (JPM), Skrill Limited owned by Paysafe (PSFE), Payline owned by Fiserv (FISV), and Authorize.net owned by Visa (V).
Weak Margins and Pricing Power
Intense competition, some of which provide free website builders, marketplaces to sell products, or e-commerce functionality as part of a larger product suite, means Squarespace must spend heavily to attract users and maintain competitiveness. Sales & marketing expenses increased from 38% of revenue in 2019 to 43% of revenue in 2020, and to 54% of revenue in the three months ended March 31, 2021. Research & development expenses increased from 22% of revenue in 2019 to 27% of revenue in 2020.
Squarespace admits in its S-1:
- Weak margins: “competitors may in the future bid on our brand names and other search terms that we use to drive traffic to our website. Such actions could increase our marketing costs and result in decreased traffic to our website.”
- Weak pricing power: “as competitors introduce new solutions, we may be unable to attract new customers at the price or based on the pricing models we currently use and we may be required to reduce prices.”
Squarespace cannot reduce prices further if it wants to have any hope of reaching long-term profitability, but not cutting prices puts user (and revenue) growth at risk.
Already Negative Margins Lag Competition
Figure 3 shows that Squarespace’s net operating profit after-tax (NOPAT) margin and ROIC rank last and second to last respectively amongst its main competitors. Lagging profitability makes justifying the sky-high expectations implied by its valuation even more unlikely.
Figure 3: Squarespace’s Profitability Vs. Closest Competition: TTM
Sources: New Constructs, LLC and company filings
*WIX earns a bottom-quintile ROIC as the company has negative NOPAT and negative invested capital
Squarespace Is Still A Small Player in Market Dominated by WordPress
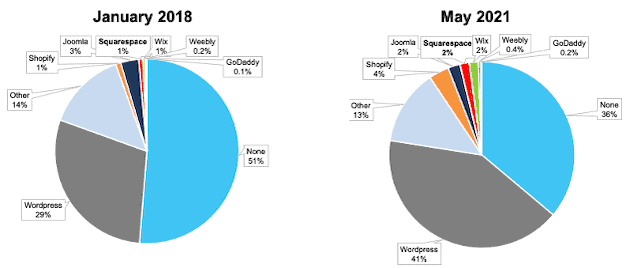
While Squarespace has grown unique subscriptions on its platform from 3 million in 2019 to 3.8 million at the end of March 2021, its use remains dwarfed by the leading website content management system, WordPress. Per Figure 4, WordPress is the content management system in use for 41% of sites on the internet. Squarespace, at 2% of sites, falls below Shopify (SHOP) and in-line with Wix (WIX).
Figure 4: Content Management Systems’ Usage Across the Internet
Sources: New Constructs, LLC and W3Techs
Buyout Would Seem Unlikely
Considering the numerous competitors commoditizing the business and the largest players in the industry already have their own offerings, we think a buyout is unlikely. There’s no need for any of the large incumbent tech companies to pay such a high price to acquire a service they already offer or could easily develop and market on their own.
Priced to Be ~2x More Profitable Than Etsy & 5x Shopify
We use our reverse discounted cash flow (DCF) model to analyze the future cash flow expectations baked into SQSP. In doing so, we find that shares are priced for growth in revenue that would increase market share (measured by revenue) from 9% in 2020 to 20% by 2030 and profits that would significantly outpace projected industry growth. Accordingly, risk/reward at the direct listing valuation is unattractive.
In order to justify its expected valuation ($10 billion), Squarespace must:
- achieve a 9% NOPAT margin (just below GoDaddy and Shopify [10%], compared to -31% for Squarespace in 2020) and
- grow revenue by 28% compounded annually for the next decade, which is above industry projections of 18% compounded annual revenue growth from 2020-2030)
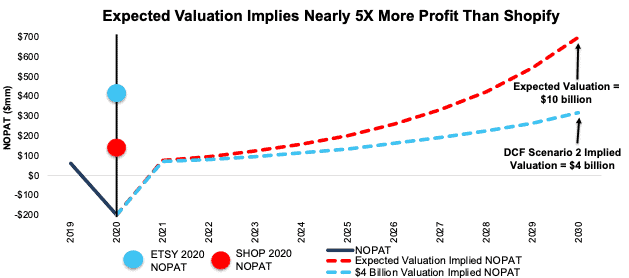
In this scenario, Squarespace would generate just over $695 million in NOPAT, which is nearly 5x Shopify’s 2020 NOPAT and ~2x Etsy’s 2020 NOPAT. Squarespace would also generate $7.7 billion in revenue (in 2030) in this scenario, which would equal 20% of its 2030 TAM, as estimated by Prescient & Strategic Intelligence, which is up from ~9% of its 2020 TAM. This market share value is based on revenue and dollar value of the entire market while Figure 4 is based on percentage of sites using a specific content management system.
DCF Scenario 2: Growth Is More In-Line with the Industry Expectations
We review an additional DCF scenario to highlight the downside risk should Squarespace’s revenue growth fall more in-line with industry expectations.
If we assume Squarespace:
- achieves a NOPAT margin of 9% and
- grows revenue by 18% compounded annually (equal to industry projections) for the next decade, then
SQSP is worth just $4.2 billion today – a 58% downside to expected direct listing valuation. See the math behind this reverse DCF scenario. Such a scenario could prove too optimistic if Squarespace increases marketing spend as a percent of revenue, thereby limiting margin improvement, or raises prices to improve profitability, thereby limiting user and revenue growth potential. In either case, the downside risk in owning shares would be even greater.
Each of the above scenarios also assumes Squarespace is able to grow revenue, NOPAT, and FCF without increasing working capital or fixed assets. This assumption is highly unlikely but allows us to create best-case scenarios that demonstrate the expectations embedded in the current valuation.
Figure 5 compares the firm’s implied future NOPAT for both scenarios to its historical NOPAT, along with the NOPAT of the peers noted above.
Figure 5: Expected Direct Listing Valuation Is Too High
Sources: New Constructs, LLC and company filings
More Red Flags
With a lofty valuation that implies significant improvement in both revenue and profits, investors should be aware that Squarespace’s S-1 also includes these other red flags.
Public Shareholders Have Very Little Rights: A risk of investing in Squarespace’s direct listing, and other recent IPOs, is the fact that the shares sold provide little to no say over corporate governance.
Squarespace is going public with three separate share classes, each with different voting rights. Investors in the direct listing will get Class A Shares, with just one vote per share while directors and early investors hold Class B Shares, with 10 votes per share.
Given the higher voting rights of Class B shares, founder and CEO Anthony Casalena will control 68% of the voting rights after the direct listing.
In other words, this direct listing gives investors little voting power or control of corporate governance.
We Don’t Know If We Can Trust the Financials: Investors should take Squarespace’s GAAP numbers with a grain of salt.
As an emerging growth company, Squarespace is not required to have an independent auditor provide an opinion on the firm’s internal controls. In its S-1, the firm notes “We have not yet determined whether our existing internal controls over financial reporting are compliant with Section 404 [of the Sarbanes-Oxley Act].”
While the lack of disclosure around the firm’s internal controls over financial reporting may never be an issue, it does increase the risk that the firm’s financials are fraudulent and/or misleading when compared to a firm required to have an auditor attest to its internal controls.
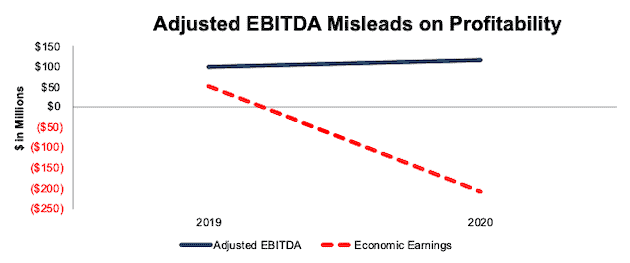
Non-GAAP EBITDA Misleads: Long a favorite of unprofitable companies, Squarespace’s chosen non-GAAP metric, adjusted EBITDA, shows a much rosier picture of the firm’s operations than GAAP net income or our Core Earnings. Adjusted EBITDA overlooks capital expenditures and gives management significant leeway in how it presents results. For example, Squarespace’s adjusted EBITDA in 2020 removes net $86 million (13% of revenue) in expenses including $31 million in stock-based compensation expense. After removing these items, Squarespace reports adjusted EBITDA of $117 million in 2020.
Meanwhile, economic earnings, the true cash flows of the business, are much lower (and declining) at -$207 million. Figure 6 shows the misleading nature of Squarespace’s adjusted EBITDA.
Figure 6: Squarespace’s Adjusted EBITDA vs. Economic Earnings: 2019-2020
Sources: New Constructs, LLC and company filings
Critical Details Found in Financial Filings by Our Robo-Analyst Technology
Fact: we provide superior fundamental data and earnings models – unrivaled in the world.
Proof: Core Earnings: New Data and Evidence, forthcoming in The Journal of Financial Economics.
Below are specifics on the adjustments we make based on Robo-Analyst findings in Squarespace’s S-1:
Income Statement: we made $334 million of adjustments, with a net effect of removing $327 million in non-operating expenses (51% of revenue). You can see all the adjustments made to Squarespace’s income statement here.
Balance Sheet: we made $136 million of adjustments to calculate invested capital with a net increase of $116 million. The most notable adjustment was $112 million in operating leases. This adjustment represented 623% of reported net assets. You can see all the adjustments made to Squarespace’s balance sheet here.
Valuation: we made $984 million of adjustments with a net effect of decreasing shareholder value by $984 million. There were no adjustments that increased shareholder value. Apart from total debt, the largest adjustment to shareholder value was $332 million in outstanding employee stock options. This adjustment represents 3% of the Squarespace’s rumored valuation. See all adjustments to Squarespace’s valuation here.
This article originally published on May 13, 2021.
Disclosure: David Trainer, Kyle Guske II, and Matt Shuler receive no compensation to write about any specific stock, style, or theme.
Follow us on Twitter, Facebook, LinkedIn, and StockTwits for real-time alerts on all our research.
[1] Only Core Earnings enable investors to overcome the errors, omissions and biases in legacy fundamental research, as proven in Core Earnings: New Data & Evidence, forthcoming in The Journal of Financial Economics.
