We published an update on SHAK on February 7, 2022. A copy of the associated update report is here.
We’re reiterating a Danger Zone pick that recently reported calendar 2Q21 earnings. Despite beating top line estimates, this business lacks differentiation and looks increasingly unlikely to achieve the profits implied by its stock price. Shake Shack (SHAK: $90/share) is in the Danger Zone.
We leverage more reliable fundamental data, proven in The Journal of Financial Economics[1], with qualitative research to highlight these firms whose stocks present poor risk/reward.
Shake Shack Has 70%+ Downside
We put Shake Shack in the Danger Zone in June 2019. Since our original report, the stock has outperformed as a short vs. the S&P 500 by 18%. After strong revenue growth in 2Q21, investors may think Shake Shack is a good investment. However, when we look below the surface, we find that Shake Shack continues to look overvalued.
What’s Working for the Business: Given the unprecedented economic shutdown across the globe in 2Q20, it should be no surprise Shake Shack reported impressive YoY revenue growth in 2Q21. Revenue jumped 104% YoY and same-shack sales increased 53% YoY, which actually came in slightly below consensus estimates of 55%.
On a non-GAAP basis, Shake Shack’s adjusted EBITDA improved from -$8.8 million in 2Q20 to $21 million in 2Q21, although investors should note Shake Shack’s adjusted EBITDA removes real costs of doing business, such as stock-based compensation, and is a poor representation of the firm’s true profits.
Going forward, Shake Shack expects sales growth to continue at a rapid pace, with the midpoint of 3Q21 guidance implying a 51% YoY revenue growth rate.
What’s Not Working for the Business: Any bull case about Shake Shack’s “growth story” ignores that consumers were spending less at locations even before the pandemic. Average weekly sales fell from $96,000 in 2016 to $79,000 in 2019, before plummeting to $58,000 in 2020. In 2Q21, Shake Shack reports rising weekly sales of $72,000, which fail to top 2019 weekly sales.
Furthermore, Shake Shack has a long history of driving same-shack sales through price increases, rather than an increase in consumer interest. While 2Q21 saw a 62% YoY increase in guest traffic, we don’t have to look far to see that in 1Q21, guest traffic was down 12% YoY while price and sales mix was up 18% YoY. If Shake Shack cannot get customers to return well above pre-pandemic levels, we see no realistic way to justify the expectations baked into its stock price.
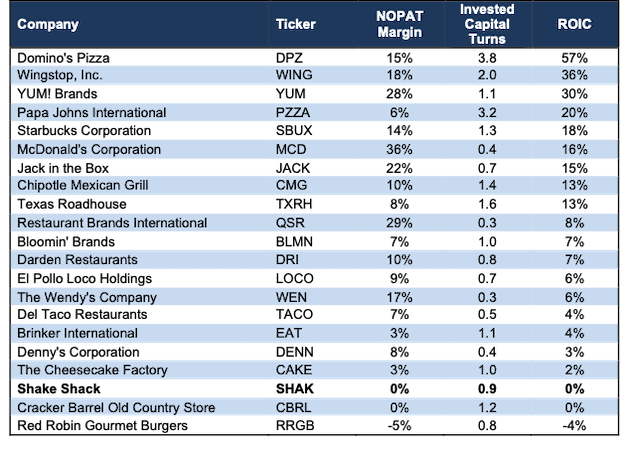
Beyond consumer interest, Shake Shack’s focus on differentiation in a commoditized burger/fast casual industry remains costly, the firm has not achieved any economies of scale, and its profitability ranks nearly last amongst its many competitors, highlighted in Figure 1.
Figure 1: Shake Shack’s Competition is Formidable
Sources: New Constructs, LLC and company filings.
Shake Shack’s food and paper costs, labor and related expenses, other operating expenses, and occupancy and related expenses were 80% of revenue in the first half of 2021, which is up from 76% over the TTM and 69% in 2016.
Total expenses, which also include general & administrative, depreciation and amortization, pre-opening costs, and impairments and losses on disposal of assets are 102% of revenue in the first half of 2021, which is up from 90% of revenue in 2016. In other words, as Shake Shack expands, its business is more costly to run.
In some ways, the fast casual restaurant boom reminds us of early days in the craft beer industry. There are many different concepts fighting for a slice of the market. However, the big difference for the fast casual industry is that the large national/global firms would rather replicate your offerings than buy the firm. The larger firms have a long history of being able to quickly and easily introduce competing products. In other words, the acquisition premium, or hope for a white knight buyer, is low for Shake Shack.
Shake Shack Priced to Surpass Bigger & More Profitable Industry Peers: To justify its current price of $90/share, Shake Shack must:
- improve its net operating profit after-tax (NOPAT) margin to 10% (equal to Chipotle’s TTM margin and well above Shake Shack’s 0.1% TTM margin or 6% 2019 margin), and
- grow revenue at a 30% CAGR through 2027 (nearly 3x projected industry growth through 2027).
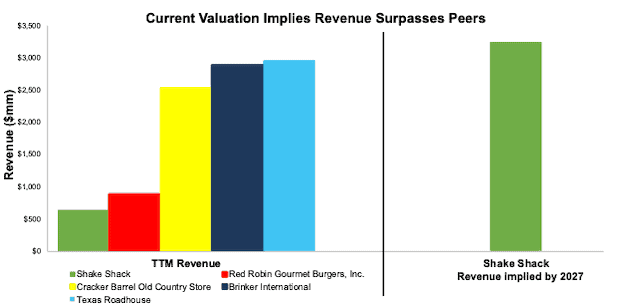
In this scenario, Shake Shack would generate $3.9 billion in revenue in 2027, which is 5x its TTM revenue and 6x its pre-pandemic 2019 revenue. At $3.2 billion, Shake Shack’s revenue would surpass industry peers such as Red Robin Gourmet Burgers (RRGB), Cracker Barrel Old Country Store (CBRL), Brinker International (EAT), and Texas Roadhouse (TXRH). See Figure 2 for comparison of Shake Shack’s implied revenue in this scenario to its peers.
We think it’s overly optimistic to assume Shake Shack will reverse years of margin deterioration (even before COVID-19, NOPAT margin fell YoY in 2017, 2018, and 2019) while also growing revenue three times as fast as the overall industry. In a more realistic scenario, detailed below, the stock has large downside risk.
Figure 2: Shake Shake’s Implied Revenue vs. Its Peers
Sources: New Constructs, LLC and company filings
SHAK Has 61%+ Downside if Consensus is Right: if we assume Shake Shack’s:
- NOPAT margin improves to 6% (equal to pre-pandemic 2019 level) and
- revenue grows at consensus rates in 2021, 2022, and 2023 and
- revenue grows 22% a year in 2024-2027 (continuation of 2023 consensus estimates), then
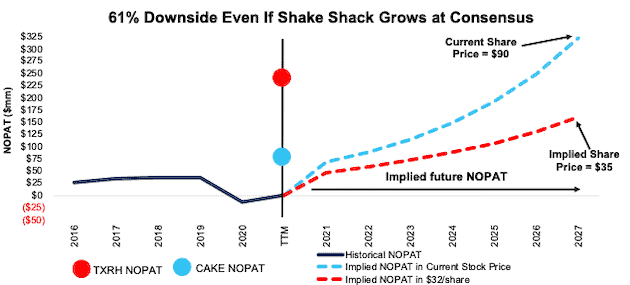
the stock is worth $35/share today – a 61% downside to the current price. This scenario still implies Shake Shack’s NOPAT quadruples from 2019 levels (highest in company history). If Shake Shack fails to improve margins (likely given that labor costs are expected to weigh on profitability) or grow revenue at consensus rates, the downside risk in the stock is even higher.
Figure 3 compares the firm’s historical NOPAT and implied NOPATs for the two scenarios we presented to illustrate just how high the expectations baked into Shake Shack’s stock price remain. For reference, we include the TTM NOPAT of peers Texas Roadhouse and Cheesecake Factory (CAKE).
Figure 3: Shake Shack’s Historical vs. Implied NOPAT
Sources: New Constructs, LLC and company filings.
There’s 70%+ Downside If Revenue Growth Slows After 2024 If we instead assume revenue growth slows beyond 2023, Shake Shack’s stock has even more downside. In this scenario, Shake Shack’s:
- NOPAT margin improves to 6% (equal to pre-pandemic 2019 level) and
- revenue grows at consensus rates in 2021, 2022, and 2023 and
- revenue grows 22% in 2024 (continuation of 2023 consensus), 20% in 2025, and 15% in 2026 and 2027, then
the stock is worth $27/share today – a 70% downside to the current price.
Each of the above scenarios assumes Shake Shack’s YoY change in invested capital is 9% of revenue in each year of our DCF model. For context, Shake Shack’s invested capital averaged 19% of revenue from 2016-TTM and invested capital has grown 19% compounded annually since 2016.
Other Danger Zone Picks That Recently Reported Earnings
Figure 4 shows other Danger Zone picks that have recently reported their calendar 2Q21 earnings along with their relative performance.
Figure 4: More Danger Zone Picks That Recently Reported Earnings: Through 8/13/21
| Company | Ticker | Earnings Date | Out (under)performance as Short vs. S&P 500 |
| Zynga Inc. | ZNGA | 8/5/21 | 11% |
| AMC Entertainment | AMC | 8/9/21 | 45%** |
| Compass Inc. | COMP | 8/9/21 | 31%* |
| Squarespace Inc. | SQSP | 8/9/21 | 16%* |
| Coinbase Global | COIN | 8/10/21 | 39%* |
| Bottomline Technologies | EPAY | 8/10/21 | 39% |
| Airbnb | ABNB | 8/12/21 | 42% |
| DoorDash Inc. | DASH | 8/12/21 | 14%* |
Sources: New Constructs, LLC
Performance measured from the date of publication of each respective report linked in the table. Performance represents price performance and is not adjusted for dividends.
*Measured from the opening price on the day of each firm’s IPO.
** Focus List Stocks: Short performance
Check out this week’s Danger Zone interview with Chuck Jaffe of Money Life.
This article originally published on August 16, 2021.
Disclosure: David Trainer, Kyle Guske II, and Matt Shuler receive no compensation to write about any specific stock, sector, style, or theme.
Follow us on Twitter, Facebook, LinkedIn, and StockTwits for real-time alerts on all our research.
[1] Our research utilizes our Core Earnings, a more reliable measure of profits, proven by professors at Harvard Business School & MIT Sloan and featured in The Journal of Financial Economics.


