Editor’s Note: Since we published this report the company changed its name and ticker to Shell, PLC (SHEL).
While demand for crude oil is expected to decline over the coming decades, demand for energy will undoubtedly continue to grow. This integrated energy firm is positioned to meet growing global demand for energy and has a management compensation structure aligned with the interests of shareholders. Royal Dutch Shell (RDS.A: $44/share) is this week’s Long Idea.
RDS.A presents quality risk/reward given the company’s:
- strategic position to serve the world’s current dependency on crude oil
- initiatives to diversify its business away from crude oil production
- strong free cash flow (FCF) generation to fund diversification into alternative energy
- superior profitability to peers
- current valuation implies profits will permanently drop by 70% from current level
Underinvestment Creates Opportunity
The value of an asset equals the present value of the future cash flows available to the owner of that asset. However, the rise in the popularity of environmental, social, and corporate governance (ESG) strategies have led many investors to ignore underlying fundamentals and divert money away from profitable energy companies. For example, Stichting Pensioenfonds ABP, the pension fund for government employees in the Netherlands, provided a noteworthy example of this trend when it announced in October that it was selling 15 billion euros-worth of holdings in legacy fossil fuel companies including Shell, the country’s largest company by revenue.
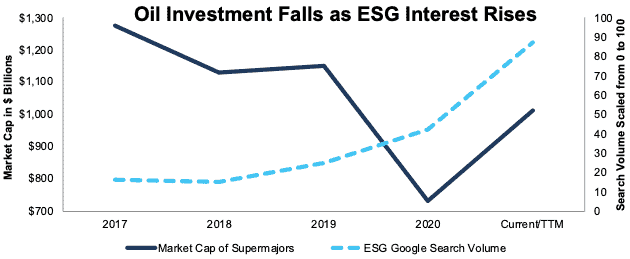
ABP is not alone. Figure 1 shows the combined market cap of the seven supermajor energy companies and the rise of the Google search term “ESG” since 2017. Supermajor companies include Exxon Mobil (XOM), Chevron (CVX), Shell, Total Energies (TTE), BP (BP), ConocoPhillips (COP), and Eni (E). While the combined Core Earnings[1] of supermajor companies fell only 1% from 2017 to the current trailing twelve month (TTM) period, the combined market cap of supermajors fell 20%.
Figure 1: Supermajor Market Cap Vs. Google ESG Search Volume Since 2017
Sources: New Constructs, LLC, company filings, and Google.
IEA Forecasts: Crude Oil Demand Will Rise Before Slow Decline
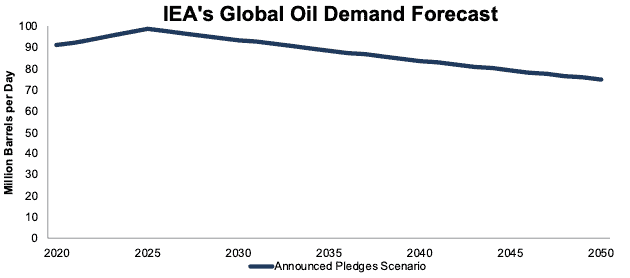
Global demand for crude oil will eventually decline, but it will not happen overnight as the media might have you believe. The decline will occur gradually across decades, and demand will likely never fall to zero as petroleum has many uses beyond energy. The International Energy Agency (IEA) provided a forecast outlining the global crude oil demand assuming (optimistically) all participants in the Paris Agreement meet their pledges. In this scenario, the IEA predicts global crude oil demand will keep rising until 2025 before falling 1% compounded annually from 2026 to 2050, per Figure 2. Even in this optimistic scenario, global crude oil demand in thirty years is just 18% below 2020 levels.
Figure 2: IEA Crude Oil Demand Forecast: Announced Pledges Scenario Through 2050
Sources: New Constructs, LLC and IEA.
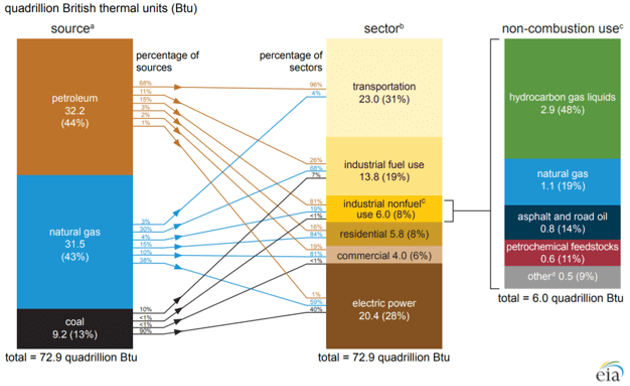
The reality is that fossil fuels have a variety of uses beyond fueling combustion engines, and the fuels themselves are to a degree interchangeable. Figure 3 below shows the sources and uses of fossil fuel consumption in the United States for 2020. Note that nearly one-third of fossil fuel usage by the industrial sector is for “non-combustion use” as feedstocks, lubricants, etc. Even if fossil fuel use in transportation and electricity production were ceased entirely, refining crude oil on a large scale would still be necessary .
Furthermore, as coal and petroleum are being pushed out of industrial use and electricity generation, frequently natural gas is coming in to take their place. In the case of electricity, coal’s steady replacement by natural gas as the fuel of choice has already been well-covered. Natural gas has also been gaining traction as the fuel of the future to replace high-sulfur marine fuel oil.
The bottom line here is that crude oil demand is not going to zero anytime in the near future. On the contrary, it is likely to remain near current levels for decades.
Headquarters Move Signals Near-Term Commitment to Fossil Fuels
Shell recently announced plans to move its headquarters from the Netherlands to Britain. The move will enable investors to avoid a new withholding tax on dividends, which is positive, but Shell is seeking more than just a favorable tax environment.
In May, a Dutch court ordered Shell to reduce its carbon emissions at a faster rate than the company had previously planned, and likely at a much faster rate than the global demand for hydrocarbons. While the company is working towards supplying the global transition to alternative energy, its move to Britain provides the flexibility to continue to supply fossil fuels if crude oil and gas demand persists beyond what climate change pledges suggest.
Figure 3: U.S. Fossil Fuel Consumption by Source and Sector: 2020
Source: EIA.
Global Energy Demand Will Continue Rising
While the supermajors are in the business of supplying crude oil and gas, they are also well-positioned to continue to meet non-crude oil energy demands. Legacy fossil fuel companies possess the engineering and project management expertise, integrated networks, and scale necessary to benefit from the transition to alternative energy supplies.
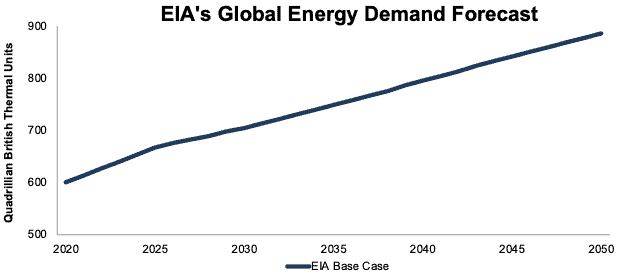
Figure 4 shows the Energy Information Administration’s (EIA) base-case scenario for global energy demand from 2020 through 2050. In this scenario, the EIA expects energy demand to grow 47% over the next three decades with demand for natural gas growing 31% from 2020 to 2050.
Figure 4: EIA Energy Demand Forecast: Base Case Through 2050
Sources: New Constructs, LLC and EIA.
LNG and Electricity Are Transitional Growth Opportunities
Though we are decades away from a zero-carbon world, Shell is focusing on growing its LNG and electricity businesses to grow its portfolio in areas that are essential for energy transition. In fact, Shell claims its crude oil production peaked in 2019.
Natural gas is the least-pollutive hydrocarbon, and liquified natural gas (LNG) enables producers to ship this cleaner burning fuel globally. Shell is the largest independent liquified natural gas (LNG) producer in the world and has grown its LNG production from 22.6 million metric tons in 2015 to 31.2 million metric tons over the TTM, a 38% increase. McKinsey expects the LNG market to grow by 200 million metric tons by 2050, up from 360 million metric tons in 2020.
Electricity is the fastest-growing part of the energy industry and plays a major role in Shell’s future. The EIA’s base case projects global electrical generation will grow 1.7% compounded annually from 25 trillion kilowatt-hours in 2020 to 42 trillion kilowatt-hours in 2050. Shell plans to leverage its vast network and brand awareness to increase its electric Power-as-a-Service business. The company aims to sell 560 terawatt hours a year and serve more than 15 million retail and business customers globally by 2030.
Climate Agreements Are Unreliable
While it may be encouraging to see 195 countries sign the Paris Agreement, “talk is cheap”, as the saying goes. Countries face no repercussions for failing to meet pledges because the Paris Agreement has no mechanism to force compliance. Accordingly, it is easy to predict that a multilateral agreement with no consequences will lead countries to overpromise and underdeliver on carbon reduction.
The Kyoto protocol encountered the same problem and illustrates the difficulty of winning cooperation from all members of an international agreement. The 38 countries that signed the Kyoto protocol in 1997 failed to achieve their stated goal by 2012 collectively. In the end, the U.S. and Canada were unwilling to stick with carbon-reducing goals that came with an economic cost. Anything is possible, but an agreement that requires carbon emissions from middle-income countries such as India and China without an enforcement mechanism looks to us more like diplomatic window-dressing than substantive policy.
Reserves Are in Growth Regions
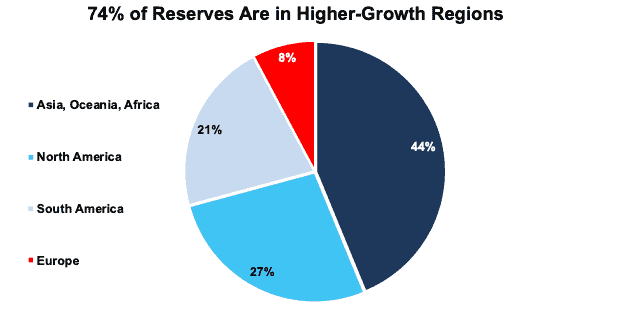
A global switch from fossil fuels to so-called green energy will not happen overnight. Low-cost energy was a big driver of the economic development of the countries in Europe and North America that are now leading the transition to clean energy. It is naïve, and, perhaps, hypocritical, to assume that less economically advanced regions of the world will not also use the lowest-cost energy source to advance their economies. Indeed, in 2021 Algeria became the last nation on Earth to ban leaded gasoline. Per Figure 5, 74% of Shell’s crude oil and gas reserves are positioned in regions where demand is likely to persist longer than in Europe or North America.
Figure 5: Shell’s Crude Oil & Gas Reserves by Region: 2020
Sources: New Constructs, LLC and company filings.
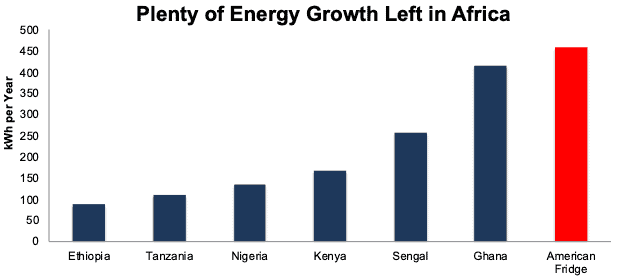
Figure 6 shows the per capita energy usage of select African countries compared to the annual energy consumption of a typical refrigerator in the U.S. Demand in this region for the cheapest sources of energy, fossil fuels, will persist as its economy continues to develop.
As Shell supports the economic growth of developing regions such as Africa, it will generate the necessary cash flows to invest in alternative energy solutions to which Europe and North America are likely to transition.
Figure 6: Per Capita Energy Use in Africa Vs. Typical American Refrigerator
Sources: New Constructs, LLC and Scott Galloway.
Alternative Energy Projects Are Future Growth Opportunities
Shell also invests in a variety of alternative projects as it prepares to meet transitioning energy demands. For example, Shell’s renewable natural gas (RNG) processes natural gas from landfills, food waste, and manure and is a natural complement to its existing natural gas business. RNG can be used in natural gas-powered vehicles and is an effective way for heavy-duty commercial vehicles to decarbonize.
Additionally, Shell is investing in the following initiatives:
- wind and solar power projects
- refueling stations in Europe and North America.
- electrolyser that produces hydrogen at its Rheinland refinery
- EV charge points by 2025
- low-carbon biofuels such as RNG
Admittedly, these projects and initiatives remain small in scale relative to Shell’s legacy fossil fuels businesses. However, over time, as new technologies are adopted these seed projects will generate the fruits of investment that will feed Shell’s shareholders for decades.
More Profitable Than Peers
Per Figure 7, Shell has the highest return on invested capital (ROIC) amongst all the supermajors over the TTM. Shell’s net operating profit after-tax (NOPAT) margin rose from 3% in 2015 to 13% over the TTM, while ROIC rose from 3% to 8% over the same time.
Looking ahead, Shell’s plan to reduce its refining operations not only helps the company meet its zero routine flaring target by 2025, but also removes low-margin operations that will help support future margin improvement. This raises a key point about the role of capital allocation in determining winners and losers in the transition to lower carbon intensity in economic activity. Firms who maximize their production of joules of energy per ton of greenhouse gas emissions will generate better returns in a regulatory environment where disposal of emissions is no longer free. We plan to revisit this topic in the future.
Figure 7: Shell’s Profitability Vs. Supermajors: TTM
Sources: New Constructs, LLC and company filings
Core Earnings Are Understated
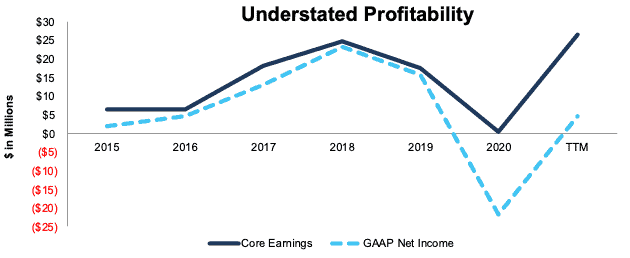
Despite a challenging operating and pricing environment, Shell has generated positive Core Earnings in each of the past 16 years. More recently, Shell grew Core Earnings from $6.6 billion in 2015 to $26.7 billion over the TTM. The firm’s GAAP earnings understate its Core Earnings over the TTM by 477%, per Figure 8.
Figure 8: Shell’s GAAP & Core Earnings Since 2015
Sources: New Constructs, LLC and company filings.
Shell’s Business Generates Significant Free Cash Flow
Shell’s crude oil and gas operations generate significant cash flow that the business can use to fund its transition to alternative energy. Over the past three years, Shell generated $76.8 billion in FCF, more than double Exxon Mobil and more than the combined FCF of Chevron, BP, and ConocoPhillips over the last three years. Per Figure 9, Shell’s three-year average FCF yield[2] of 10% is tops amongst its peers.
Figure 9: Shell’s FCF Vs. Competitors: TTM
Sources: New Constructs, LLC and company filings
RDS.A Is Priced for Profits to Fall 70% Below TTM Levels
Shell’s price-to-economic book value (PEBV) of 0.3 means the stock is priced for profits to fall, permanently, by 70% from TTM levels. Below we use our reverse discounted cash flow (DCF) model to analyze the future cash flow expectations baked into Shell’s stock price. We also provide an additional scenario to highlight the upside potential in shares if Shell grows revenue at consensus rates.
DCF Scenario 1: to Justify the Current Stock Price.
We assume Shell’s:
- NOPAT margin falls to 6% (15-year average from 2005-2019 vs. 13% TTM) in 2021 through 2040,
- revenue grows at a 17% CAGR from 2021 - 2023 (equal to consensus estimates), and
- revenue falls 4% compounded annually from 2023-2040.
In this scenario, Shell’s NOPAT falls 4% compounded annually from 2019 to 2040 and the stock is worth $44/share today – equal to the current price. In this scenario, Shell earns $11.4 billion in NOPAT in 2040, or 46% below 2019 levels.
DCF Scenario 2: Shares Are Worth $72+.
If we assume Shell’s:
- NOPAT margin falls to 7% (3-year average from 2016-2019) from 2021 through 2040,
- revenue grows at a 17% CAGR from 2021 - 2023, and
- revenue falls at a 1% CAGR (equal to IEA’s “Pledge” scenario from 2023-2050) from 2023-2040 then
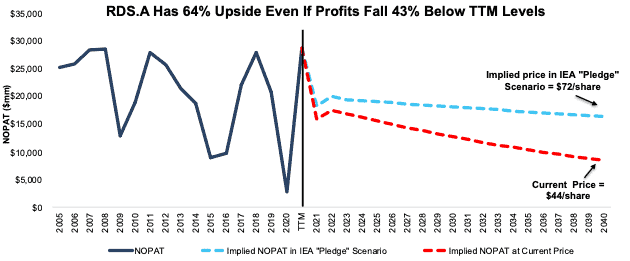
RDS.A is worth $72/share today – a 64% upside to the current price. See the math behind this reverse DCF scenario. In this scenario, Shell’s NOPAT falls to $16.4 billion in 2040, or 43% below TTM levels. For reference, Shell averaged $20.3 billion in annual NOPAT from 2010 to 2019. Should Shell’s NOPAT not fall at such a steep rate, or even grow over the coming years, then the stock has even more upside.
Figure 10 compares Shell’s historical NOPAT to its implied NOPAT in each of the above DCF scenarios.
Figure 10: Shell’s Historical and Implied NOPAT: DCF Valuation Scenarios
Sources: New Constructs, LLC and company filings.
Sustainable Competitive Advantages Will Drive Shareholder Value Creation
Here’s a summary of why we think the moat around Shell’s business will enable it to continue to generate higher NOPAT than the current market valuation implies. The following competitive advantages also help Shell grow in a transitioning market:
- large cash flow generating business to fund alternative energy investments
- engineering and project management expertise
- scale necessary to profitably transition to alternative energy production
- strong brand awareness
- high profitability compared to peers
What Noise Traders Miss With Shell
These days, fewer investors focus on finding quality capital allocators with shareholder friendly corporate governance. Instead, due to the proliferation of noise traders, the focus is on short-term technical trading trends while more reliable fundamental research is overlooked. Here’s a quick summary of what noise traders are missing:
- the persistence of global dependency on fossil fuels
- growth potential within Shell’s alternative energy projects
- long-term rise of global energy demand
- valuation implies profits will fall 61% below average pre-pandemic levels from 2005-2019
Earnings Beats and a Cold Winter Could Send Shares Higher
With GAAP earnings understated by 477%, RDS.A earns our Beat Earnings Distortion Score. This indicates that Shell has a high likelihood of beating earnings estimates for 4Q21, which it has done in eight of the past 12 quarters, according to Zacks. Doing so again could send shares higher.
Additionally, should extreme weather exacerbate the energy crunch this winter, Shell’s shares could soar along with rising crude oil and natural gas prices.
Dividends and Share Repurchases Could Provide 9.1% Yield
Shell has paid a dividend in every year since 2006. Since 2017, Shell has paid $49.2 billion (29% of current market cap) in cumulative dividends. The firm’s current dividend, when annualized, provides a 4.4% yield.
Shell also returns capital to shareholders through share repurchases. From 2017 to 2020, the firm repurchased $15.8 billion (9% of current market cap) of stock. Shell has repurchased $1.2 billion over the TTM. If the company continues to repurchase shares at the same rate, the buybacks will provide an annual yield of 0.7% at its current market cap.
Furthermore, the firm recently announced an additional buyback distribution of $1.5 billion as part of a total $7 billion plan to distribute proceeds related to the sale of its Permian business. Though the firm will wait until early 2022 to announce the remaining Permian-related buyback tranches, should it return the entire $7 billion within the next twelve months, shareholders will receive an additional yield of 4.0% at its current market cap.
Executives’ and Shareholders’ Interests Are Aligned
No matter the macro environment, investors should look for companies with executive compensation plans that directly align executives’ interests with shareholders’ interests. Quality corporate governance holds executives accountable to shareholders by incentivizing them to allocate capital prudently.
Shell compensates executives with salaries, annual bonuses, and long-term equity awards.
Twenty percent of the company’s long-term performance share awards in 2021 are based on a return on average capital employed (ROACE) growth target, which is excellent in our view. The company calculates capital employed as “the sum of total equity and total debt”. The company’s calculation of average capital employed does not account for asset write-downs as our average invested capital does. However, that adjustment would add just 20% to Shell’s number for average capital employed in 2020.
Tying executive compensation to ROIC, or something similar like ROACE, ensures that executives’ interests are actually aligned with shareholders’ interests as there is a strong correlation between improving ROIC and increasing shareholder value.
Shell’s focus on creating shareholder value has helped it grow economic earnings from -$9.7 billion in 2016 to $13.5 billion TTM.
Insider Trading and Short Interest Trends
There is no data available related to insider transactions.
There are currently 4.3 million shares sold short, which equates to <1% of shares outstanding and under one day to cover. Short interest is up 9% from the prior month. The lack of short interest reveals not many are willing to take a stake against this free cash flow generator.
Critical Details Found in Financial Filings by Our Robo-Analyst Technology
Fact: we provide more reliable fundamental data and earnings models – unrivaled in the world.
Proof: Core Earnings: New Data & Evidence, forthcoming in The Journal of Financial Economics.
Below are specifics on the adjustments we make based on Robo-Analyst findings in Shell’s 10-K and 10-Qs:
Income Statement: we made $41.4 billion of adjustments, with a net effect of removing $24.4 billion in non-operating expenses (13% of revenue). You can see all the adjustments made to Shell’s income statement here.
Balance Sheet: we made $151.8 billion of adjustments to calculate invested capital with a net increase of $67.3 billion. One of the largest adjustments was $55 billion in asset write-downs. This adjustment represented 18% of reported net assets. You can see all the adjustments made to Shell’s balance sheet here.
Valuation: we made $153.4 billion of adjustments to shareholder value for a net effect of decreasing shareholder value by $80.5 billion. Apart from total debt, one of the most notable adjustments to shareholder value was $30.5 billion in excess cash. This adjustment represents 18% of Shell’s market cap. See all adjustments to Shell’s valuation here.
Attractive Fund That Holds RDS.A
The following fund receives our Attractive rating and allocates significantly to RDS.A:
- Barrett Opportunity Fund, Inc (SAOPX) – 6.8% allocation
This article originally published on December 9, 2021.
Disclosure: David Trainer, Kyle Guske II, and Matt Shuler receive no compensation to write about any specific stock, style, or theme.
Follow us on Twitter, Facebook, LinkedIn, and StockTwits for real-time alerts on all our research.
[1] Only Core Earnings enable investors to overcome the inaccuracies, omissions and biases in legacy fundamental data and research, as proven in Core Earnings: New Data & Evidence, written by professors at Harvard Business School (HBS) & MIT Sloan and published in The Journal of Financial Economics.
[2] Three-year average FCF / TTM Enterprise Value

