We published an update on NFLX on April 20, 2022. A copy of the associated update report is here.
We’ve been bearish on Netflix (NFLX: $380/share) for years, not because it provides a poor service, but because the firm is a bait fish in a tank filled with sharks.
With the subscriber miss in 4Q21 and weak guidance for subscriber growth in 1Q22, the weaknesses in Netflix’s business model are undeniable. Even after falling 47% from its 52-week high, we think the stock could have a further 66% downside.
As we’ll show, strong competition is taking market share, and it’s becoming clear that Netflix cannot generate anything close to the growth and profits implied by the current stock price.
Netflix Loses Market Share: Subscriber Growth Continues to Disappoint
Netflix added 8.28 million subscribers in 4Q21, below its prior estimate of 8.5 million and consensus estimates of 8.32 million. Management guided for 2.5 million additions in 1Q22, which would represent a 37% year-over-year (YoY) decline in subscriber additions and be the slowest subscriber growth of the past four years.
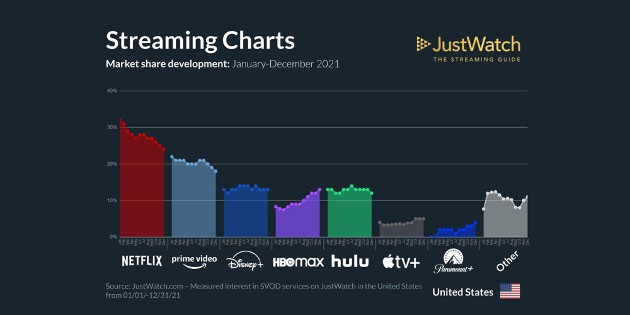
We expect that such muted growth is the new normal, as noted in our April 2021 report because competition is taking meaningful market share from Netflix and making subscriber growth more expensive. Figure 1 highlights Netflix’s U.S. market share loss in 2021, as well as the clear gains by HBO Max, Apple TV+, and Paramount+.
Figure 1: Netflix Losing Market Share to Competitors
Source: JustWatch
We expect Netflix will continue to lose market share as more competitors enter the market and deep-pocketed peers such as Disney (DIS), Amazon (AMZN), and Apple (AAPL) continue to invest heavily in streaming.
No Longer the Only Game in Town
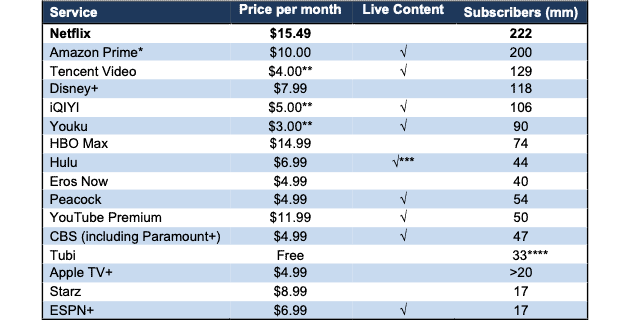
The streaming market is now home to at least 15 services with more than 10 million subscribers (see Figure 2). Many of these competitors, such as Disney, Amazon, YouTube (GOOGL), Apple, Paramount (VAIC) and HBO Max (T) have at least one of two key advantages:
- profitable businesses that subsidize lower-cost streaming offerings
- a deep catalog of content that is owned by the company, rather than licensed from others
Competing against firms that make enough money in other business that they can afford to lose money in their streaming businesses means Netflix may never generate positive cash flows. Netflix also suffers from a “winner’s curse” with its licensed content: as it gains subscribers, the content owners know they can charge more to license content. Netflix has had impressive success with content generation but, until it has a deep content catalogue of its own, it must pay costly licensing fees and spend heavily to build brand cache.
Figure 2: Lots of Competitors in Online Streaming
Sources: New Constructs, LLC and company filings.
Prices represent subscription level with the most similar features across each offering
*Represents Amazon Prime members, all of which can use Amazon Prime. Amazon hasn’t officially disclosed Prime Video users.
**Pricing based in Yuan, converted to Dollars
*** Requires subscription to Hulu + Live TV
***Monthly Active Users (MAUs). As a free service, Tubi reports MAUs instead of numbers of subscribers.
Harder to Hike Prices With So Many Low-Cost Alternatives
We underestimated Netflix’s ability to raise prices while maintaining subscription growth. We expected competitors to enter the streaming market sooner but, now that competition is showing up in strength, our thesis is playing out as expected. Netflix’s recent price hike will be a true test of how sticky its user base is.
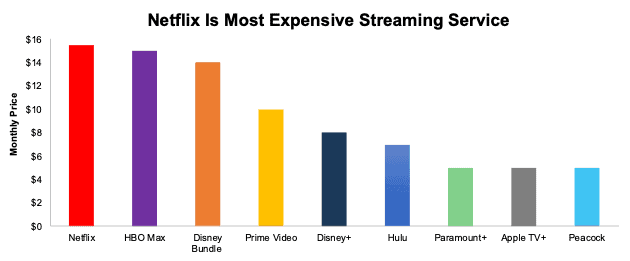
Consumers have a growing list of lower-cost alternatives to Netflix so a willingness to accept price hikes is not a given. Per Figure 3, Netflix now charges more than every other major streaming service. For reference, we use Netflix’s “Standard” plan and the equivalent packages from competitors in Figure 3.
Figure 3: Monthly Price for Streaming Services in the U.S.
Sources: New Constructs, LLC
Acquiring Customers Has Never Been More Expensive
A combination of rising inflation and increasing competition have left Netflix paying more than ever to acquire subscribers. Marketing costs and streaming content spending has risen from $959 per new subscriber in 2019 (pre-pandemic) to $1,113 per new subscriber in 2021.
For a user paying $15/month in the US, it takes over six years for Netflix to break even. In Europe and Latin America, where average revenue per membership is lower, this break-even is eight years and eleven years, respectively.
Growth or Profits, Never Both
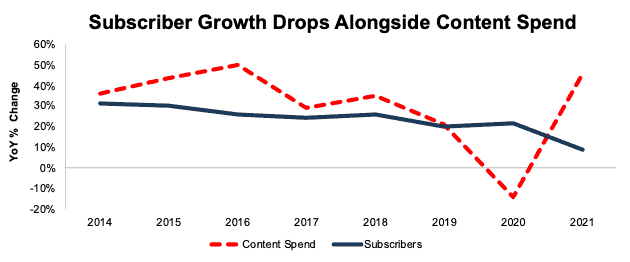
Netflix’s free cash flow was positive in 2020 for the first time since 2010, frequently a positive sign for a company. But, in this case, positive FCF coincides with Netflix cutting content spending during the COVID-19 pandemic. It also coincides with sharply slower subscriber growth (see Figure 4), which is hardly a surprise considering the hyper-competitive, content-driven nature of the streaming business.
Netflix’s management plans to do what the company has always done, spend more on content. But the long-term slowdown in subscriber growth suggests that throwing billions of dollars at content will not be enough to fend off its competition. What 2020 and 2021 showed Netflix was that the wolf is always at their door. Without spending heavily on content and marketing, new subscribers will not show up.
Figure 4: Change in Subscriber Growth & Content Spend: 2014 – 2021
Sources: New Constructs, LLC and company filings.
Limited Ability to Monetize Content Creates a Cash Burning Business
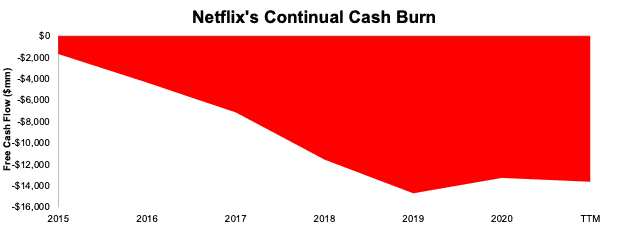
Because of the heavy spending required to produce content, the company has burned through $11.7 billion in FCF over the past five years. Over the TTM, free cash flow sits at -$374 million. Heavy cash burn is likely to continue given that Netflix has one revenue stream, subscriber fees, while competitors such as Disney monetize content across theme parks, merchandise, cruises, and more. Competitors such as Apple, AT&T (T) and Comcast/NBC Universal (CMCSA) generate cash flows from other businesses that can help fund content production and general losses on streaming platforms.
The question then becomes, how long will investors keep fronting cash to support subscriber growth without profit growth. We don't think Netflix’s money-losing, mono-channel streaming business has the staying power to compete with Disney’s (and all the other video content producers’) original content spending – at least not at the level to grow subscribers and revenue at the rates implied by its valuation.
Figure 5: Netflix’s Cumulative Free Cash Flow Since 2015
Sources: New Constructs, LLC and company filings.
Lack of Live Content Limits Subscriber Growth
Netflix has historically stayed out of the live sports arena, a stance that looks unlikely to change. Co-CEO Reed Hastings stated in mid 2021 Netflix would require exclusivity that is not offered by sport leagues in order to “offer our customers a safe deal.” For consumers that require live content as part of their streaming needs, Netflix is either not an option, or must be purchased as a complementary service with a competitor.
Meanwhile, Disney, Amazon, CBS, NBC, and Fox (each of which has its own streaming platform) are securing rights to more and more live content, especially the NFL and NHL, giving them a very popular offering that Netflix cannot match.
Netflix’s Valuation Implies Subscribers Will Double
We use our reverse discounted cash flow (DCF) model and find that the expectations for Netflix’s future cash flows look overly optimistic given the competitive challenges above and guidance for slowing user growth. To justify Netflix’s current stock price of ~$380/share, the company must:
- maintain its 2020 NOPAT margin of 16%[1] (vs. TTM of 18.5%, three-year average of 12%, and five-year average of 9% and
- grow revenue 14% compounded annually through 2027, which assumes revenue grows at consensus estimates in 2022-2024 and 14% each year thereafter
In this scenario, Netflix’s implied revenue in 2027 of $63.1 billion is 4.8x the TTM revenue of Fox Corp (FOXA), 2.4x the TTM revenue of ViacomCBS (VIAC), 1.6x the combined TTM revenue of Fox Corp and ViacomCBS (VIAC) and 94% of Disney’s TTM revenue.
To generate this level of revenue and reach the expectations implied by its stock price, Netflix would need:
- 340 million subscribers at an average monthly price of $15.49/subscriber
- 472 million subscribers at an average monthly price of $11.15/subscriber
$15.49 is the new monthly price for Netflix’s standard U.S. plan. However, the majority of Netflix’s subscriber growth comes from international markets, which generate much less per subscriber. The combined (U.S. and international) average monthly revenue per subscriber is $11.15. At that price, Netflix needs to more than double its subscriber base to over four-hundred seventy million to justify its stock price.
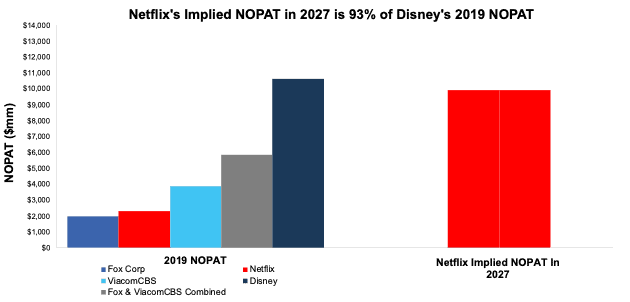
Netflix’s implied NOPAT in this scenario is $9.9 billion in 2027, which would be 5x the 2019 (pre-pandemic) NOPAT of Fox Corp, 2.6x the 2019 NOPAT of ViacomCBS, 1.7x the combined 2019 NOPAT of Fox Corp and ViacomCBS, and 93% of Disney’s 2019 NOPAT.
Figure 6 compares Netflix’s implied NOPAT in 2027 with the TTM NOPAT[2] of other content production firms.
Figure 6: Netflix’s 2019 NOPAT and Implied 2027 NOPAT vs. Content Producers
Sources: New Constructs, LLC and company filings.
There’s 47% Downside if Margins Fall to 3-Year Average
Below, we use our reverse DCF model to show the implied value of NFLX under a scenario with a realistic assessment of the mounting competitive pressures facing Netflix. Specifically, if we assume:
- Netflix’s NOPAT margin falls to 12.1% (equal to its 3-year average) and
- Netflix grows revenue by 11% compounded annually through 2027, (above management’s guided YoY revenue growth rate for 1Q22) then
the stock is worth just $202/share today – a 47% downside. In this scenario, Netflix’s revenue in 2027 would be $52.2 billion, which implies Netflix has 281 million subscribers at the current U.S. standard price of $15.49 or 390 million subscribers at the overall average revenue per subscriber of $11.15/month. For reference, Netflix’s has 222 million subscribers at the end of 2021.
In this scenario, Netflix’s implied revenue of $52.2 billion is 4x the TTM revenue of Fox Corp, 1.9x the TTM revenue of ViacomCBS, 1.3x the combined TTM revenue of Fox Corp and ViacomCBS and 77% of Disney’s TTM revenue.
Netflix’s implied NOPAT in this scenario would be 3x the 2019 (pre-pandemic) NOPAT of Fox Corp, 1.6x the 2019 NOPAT of ViacomCBS, 1.1x the combined 2019 NOPAT of Fox Corp and ViacomCBS, and 58% of Disney’s 2019 NOPAT.
There’s 66% Downside if Margins Fall to 5-Year Average
Should Netflix’s margins fall even further due to competitive pressures for more spending on content creation and/or subscriber acquisition, the downside is even greater. Specifically, if we assume:
- Netflix’s NOPAT margin falls to 9.2% (equal to its 5-year average) and
- Netflix grows revenue by 11% compounded annually through 2027, (above management’s guided YoY revenue growth rate for 1Q22) then
the stock is worth just $131/share today – a 66% downside. In this scenario, Netflix’s implied revenue and subscribers would be the same as in Scenario 2. Netflix’s implied NOPAT in this scenario would be 2.4x the 2019 (pre-pandemic) NOPAT of Fox Corp, 1.2x the 2019 NOPAT of ViacomCBS, 82% the combined 2019 NOPAT of Fox Corp and ViacomCBS, and 45% of Disney’s 2019 NOPAT.
Maybe Too Optimistic
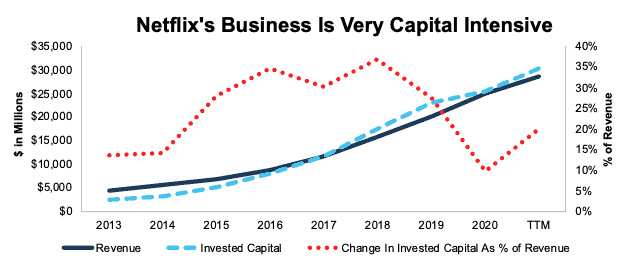
The above scenarios assume Netflix’s YoY change in invested capital is 10% of revenue (equal to 2020) in each year of our DCF model. For context, Netflix’s invested capital has grown 38% compounded annually since 2013 and change in invested capital has averaged 24% of revenue each year since 2013.
Figure 7 shows just how capital-intensive Netflix’s business has been since 2013. Not only is invested capital larger than revenue but the YoY change in invested capital has been equal to or greater than 10% of revenue each year since 2013. It is more likely that spending will need to be much higher to achieve the growth in the above forecasts, but we use this lower assumption to underscore the risk in this stock’s valuation.
Figure 7: Netflix Revenue, Invested Capital, and Change in Invested Capital as % of Revenue: 2013-TTM
Sources: New Constructs, LLC and company filings.
Fundamental Research Provides Clarity in Frothy Markets
2022 has quickly shown investors that fundamentals matter and stocks don’t only go up. With a better grasp on fundamentals, investors have a better sense of when to buy and sell – and – know how much risk they take when they own a stock at certain levels. Without reliable fundamental research, investors have no way of gauging whether a stock is expensive or cheap.
As shown above, by combining more reliable fundamental research with our reverse DCF model, we show that even after plummeting post-earnings, NFLX still holds significant downside.
This article originally published on January 25, 2022.
Disclosure: David Trainer, Kyle Guske II, and Matt Shuler receive no compensation to write about any specific stock, style, or theme.
Follow us on Twitter, Facebook, LinkedIn, and StockTwits for real-time alerts on all our research.
[1] Assumes NOPAT margin falls to be closer with historical margins as costs increase from pandemic lows. For example, Netflix’s gross margin fell quarter-over-quarter in all four quarters of 2021.
[2] We use 2019 NOPAT in this analysis to analyze the pre-COVID-19 profitability of each firm, given the pandemic’s impact on the global economy in 2020 and 2021.

