As the MOMO, YOLO, and BTFD days sink deeper into the past, we remind investors to focus on fundamentals. Fundamental research might seem boring, but it is the only way to find companies that generate real profits and have stocks that carry less risk. Boring investments can be very rewarding.
CarMax, Inc. (KMX: $88/share) is one of this week’s Long Ideas. The other Long Idea is Johnson & Johnson (JNJ: $185/share), which we cover in a separate report here.
Fundamentals Are as Important Now as Ever
In the midst of economic uncertainty and market volatility, investors should make sure – now more than ever – their portfolios are filled with companies that generate Core Earnings and trade at cheap valuations.
After years of pouring easy money into popular growth companies, the market is no longer tolerating bottom-line losses no matter how strong the top-line growth.
Investors should focus on companies with the following characteristics, regardless of the economic outlook:
- consistent Core Earnings growth
- high return on invested capital (ROIC) compared to peers
- rising economic earnings
- strong free cash flow (FCF)
- low price-to-economic book value (PEBV)
CarMax Has Outperformed Carvana by 60%
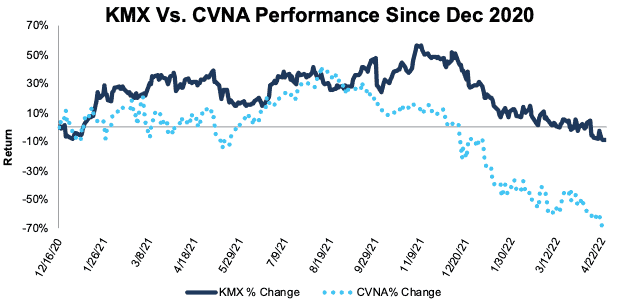
Despite falling 42% from its November 2021 highs, due to concerns of the business’ rising costs, CarMax’s stock has performed much better than shares of rival Carvana (CVNA) (latest report here) since we made CarMax a Long Idea on December 16, 2020. Since then, CarMax’s stock is down 9% compared to a 69% decline for CVNA over the same time. See Figure 1.
Figure 1: Price Performance: KMX Vs. CVNA Since 12/16/20
Sources: New Constructs, LLC
While the market may be overly pessimistic about the prospects of the used car industry, it’s clearly differentiating between the performance of companies within the industry. A strong underlying business positions CarMax to deliver long-term revenue and profit growth. The recent decline in its stock price provides an entry point to own this quality business at a cheap valuation.
Strong Core Earnings Growth Before Pandemic
Concerns over the company’s ability to match impressive fiscal 2022 Core Earnings performance loom over the stock. Indeed, Core Earnings in 4Q22 were 34% below 4Q21 and 31% below 4Q20. Historically-low gross margins and rising expenses could persist in the near term and drive CarMax’s fiscal 2023 Core Earnings below fiscal 2022 levels.
However, CarMax’s consistent profit growth before the pandemic suggests, over the long run, Core Earnings will return to trend growth. CarMax’s Core Earnings grew from $281 million in fiscal 2010 to $888 million in fiscal 2020 (FYE 2/29/20), or 12% compounded annually. Over the past two years, CarMax’s Core Earnings averaged $931 million, which is 5% above fiscal 2020 levels.
In contrast, Carvana’s Core Earnings have not been positive since 2015 (earliest year in our model). The company’s Core Earnings fell from -$40 million in 2015 to -$127 million in 2021. With a shortage of new vehicles driving record levels of demand in the used vehicle market, Carvana’s inability to generate positive Core Earnings stands in stark contrast to CarMax, which delivered its highest Core Earnings ever in fiscal 2022 (FYE ended 2/28/22).
CarMax Creates Shareholder Value While Carvana Destroys It
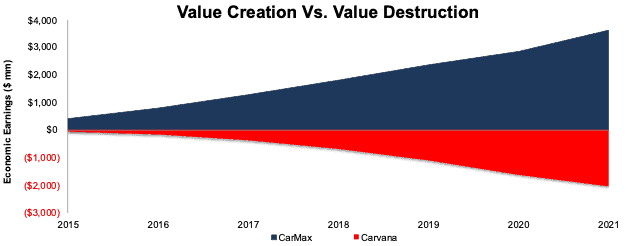
Unlike GAAP earnings, economic earnings are a more accurate representation of the true underlying cash flows of a business because they account for changes to the balance sheet as well as the income statement. CarMax’s economic earnings grew from $401 million in fiscal 2016 (calendar 2015[1]) to $757 million in fiscal 2022 (calendar 2021). Over that period, CarMax generated cumulative economic earnings of $3.6 billion, while Carvana generated -$2.1 billion of economic earnings.
Figure 2: CarMax’s and Carvana’s Cumulative Economic Earnings Since Calendar 2015
Sources: New Constructs, LLC and company filings
Market Share Improved YoY, Too
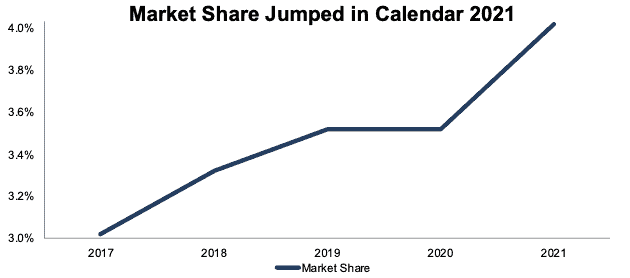
CarMax is the largest retailer of used cars in the U.S. (by volume) and continues to take market share. Per Figure 3, the company’s share of the market for used cars aged 10 years-or-less (the standard measure for the used vehicle market) has grown from 3% in calendar 2017 to 4% in calendar 2021. In calendar 2021 alone, CarMax improved its market share by ~50 basis points while also generating record Core Earnings.
CarMax emphasized in its fiscal 4Q22 earnings call that it will focus on growing its market share as it continues to “invest and innovate to achieve profitable market share growth”. The company’s large footprint, large selection, and competitive prices should continue to attract customers in a tight used vehicle market. Management expects its share of its target market to reach 5% by calendar 2025.
Figure 3: CarMax’s Share of U.S. Sales of Used Car Market
Sources: New Constructs, LLC and company filings
Used Car Demand Looks Strong in the Near and Long Term
Though the tightening supply of used cars and rising labor costs have curbed enthusiasm for the used car industry, used car sales and prices are well above pre-pandemic levels. Given car manufacturers’ inability to meet new car demand over the next few years, demand for used cars is likely to remain at historically strong levels. In fact, Grand View Research expects the global used car market to grow at a 6% compound annual growth rate (CAGR) through calendar 2030.
CarMax is ready to meet the growing demand for used cars. The company increased its inventory in fiscal 2022 and is planning to add ten new stores in fiscal 2023.
A Proven Leader
CarMax is able to achieve what Carvana hasn’t – profitable market share growth. CarMax’s wholesale segment is integral to its profitability and success in sourcing quality used cars. The wholesale business bolsters the quality of its retail offerings by providing a channel to profitably offload lower-quality vehicles at its auctions. Furthermore, the wholesale business provides the company with real-time insights into pricing and demand in the used car market.
Time will tell whether Carvana’s attempt to increase its physical presence and wholesale operation through its acquisition of auction house ADESA U.S. will improve the business’s profitability. In the meantime, CarMax already operates a very profitable omni-channel wholesale and retail business at unprecedented scale.
Investors Are Missing Industry-Leading Balance Sheet Efficiency
Analysts are disappointed with CarMax’s declining net operating profit after tax (NOPAT) margins, which fell from 5% in fiscal 2020 to a thirteen-year low of 4% in fiscal 2022. Management stated in its fiscal 4Q22 earnings call that they “chose to pass along some of our self-efficiency acquisition cost savings to consumers via lower prices” which looks to be a prudent move given the market share gains the company achieved in calendar 2021.
However, the company’s profitability is stronger than its margins might suggest. CarMax’s new instant online appraisal offering contributed to the company’s wholesale unit sales growing 44% YoY in fiscal 4Q22. Growth in the wholesale segment helped CarMax’s industry-leading invested capital turns (our measure of balance sheet efficiency) rise from 3.3 in fiscal 2020 to 3.8 in fiscal 2022. The company will look to continue to improve its invested capital turns as it focuses on growing wholesale unit sales through its online channel.
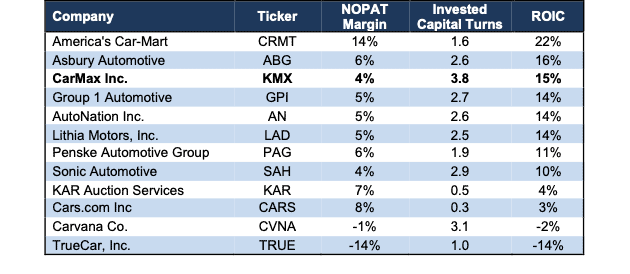
CarMax’s rising invested capital turns support the company’s high ROIC, which ranks third amongst its peer group. Carvana’s ROIC, on the other hand, is negative and ranks second to last. See Figure 4.
Figure 4: CarMax’s Profitability Vs. Competition: TTM
Sources: New Constructs, LLC and company filings
KMX Has 43%+ Upside If Consensus Is Correct
CarMax’s PEBV ratio[2] of 1.1 means the stock is priced for profits to only grow 10% above fiscal 2020 levels. Such an assumption seems overly pessimistic, given the company grew NOPAT by 13% compounded annually from fiscal 2010 to 2020.
Below we use our reverse discounted cash flow (DCF) model to analyze two future cash flow scenarios and highlight the upside potential in CarMax’s current stock price.
DCF Scenario 1: to Justify the Current Stock Price of $88/share.
If we assume CarMax’s:
- NOPAT margin remains at fiscal 4Q22 levels of 2% in fiscal 2023 – 2024,
- NOPAT margin rises to 4% (13-year low and equal to fiscal 2022) in fiscal 2025 – 2032 and
- revenue falls 2% (vs. fiscal 2023 – 2024 consensus estimate CAGR of +3%) compounded annually from fiscal 2023 – 2032, then
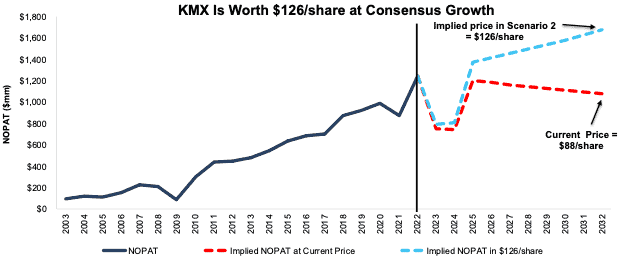
the stock is worth $88/share today – equal to the current price. In this scenario, CarMax earns $1.1 billion in NOPAT in fiscal 2032, which is just 7% above its pre-pandemic NOPAT in fiscal 2020.
DCF Scenario 2: Shares Are Worth $126+
If we assume CarMax:
- NOPAT margin remains at fiscal 4Q22 levels of 2% in fiscal 2023 – 2024,
- NOPAT margin rises to 4% (13-year low and equal to fiscal 2022) in fiscal 2025 – 2032 and
- grows revenue at 3% from fiscal 2023 – 20232,
the stock is worth $126/share today – a 43% upside to the current price. In this scenario, CarMax’s NOPAT grows just 3% compounded annually for the next decade. For reference, CarMax grew NOPAT at a 9% CAGR from fiscal 2015 – 2020 before the COVID-19 pandemic. Should CarMax’s NOPAT grow in line with pre-pandemic growth rates, the stock has even more upside.
Figure 5 compares CarMax’s historical NOPAT to its implied NOPAT in each of the above DCF scenarios.
Figure 5: CarMax’s Historical and Implied NOPAT: DCF Valuation Scenarios
Sources: New Constructs, LLC and company filings
This article originally published on April 27, 2022.
Disclosure: David Trainer, Kyle Guske II, and Matt Shuler receive no compensation to write about any specific stock, style, or theme.
Follow us on Twitter, Facebook, LinkedIn, and StockTwits for real-time alerts on all our research.
[1] For this analysis, we compare CarMax’s calendar 2015 financials (fiscal year ended 2/29/16) to Carvana’s calendar 2015 financials (fiscal year ended 12/31/15).
[2] We calculate CarMax’s PEBV ratio using the company’s pre-pandemic, fiscal 2020 NOPAT, which represents a more normal level of profits than the record profits in fiscal 2022.

