The market is clearly wary of the once-popular chipmaker. Over the past year, Intel (INTC) has significantly lagged the NASDAQ composite Index and has one of the highest short ratios of any company in the Dow Jones Industrial Average. Of the 44 analysts with ratings on INTC, eight (18%) have an “Underperform” or “Sell” rating on it. By comparison, only 6.5% of all Wall Street analyst ratings are below “Hold”. Analysts are nearly three times more bearish on INTC than the average stock (proof of how Wall Street ratings can be misleading).
Remember Warren Buffet’s famous advice: “Be fearful when others are greedy and greedy when others are fearful.” In this exuberant bull market where zero-profit companies boast market caps in the billions, the sentiment around INTC is as close to fearful as you’re going to see. That’s why now is the perfect time to get greedy.
Why The Bears Are Wrong
The bearish argument against INTC revolves around the perception that the company is stuck in the “dying” PC market and cannot catch up to competitors like ARM Holdings (ARMH) and Qualcomm (QCOM) in the growing market for mobile devices. They point to the revenue and profit decline in recent years as the start of a long-term downtrend for the company.
The problem with all these arguments is that they rest on the fallacy that present trends will continue indefinitely. Let’s go through the bearish arguments point by point and examine why they don’t hold water.
– Dying PC Industry: Yes, PC sales over the past few years have seen significant declines, but reports of the personal computer’s death are greatly exaggerated. Tablets may be great as consumption devices, but most businesses and many individuals still require the higher performance capabilities of PC’s. Recent results from INTC suggest that PC sales are nearing a bottom, and results from other companies support that conclusion.
– Stuck Behind Competitors: INTC is late to the game in mobile, where QCOM chips based on the ARMH architecture have grabbed a major market share. The good news is that INTC’s management has over $23 billion of excess cash that they are leveraging to gain traction in this high-growth market. From 2010-2012, INTC increased R&D spending by 54% (from 2000-2010, R&D only grew by 69%). INTC’s $10 billion R&D budget is more than double that of QCOM and well beyond anything ARMH can manage. A larger budget doesn’t guarantee success, but INTC’s budget and history of excellent chip design makes it hard to bet against the company gaining some ground in tablets and mobile devices. The early success of INTC’s new tablet processors suggests that the company is on the right track.
– Declining Revenue and Profits: As mentioned above, the decline in profits is largely due to the impact of increased R&D spending (up almost $4 billion from 2010), and the revenue declines seem to be leveling off. In fact, in 3Q13 INTC actually saw a year-over-year increase in revenues as the decline in PC sales was countered by growth in INTC’s $11 billion/year (20% of revenue) data center business.
Fundamentally Sound
Even with 2012 being a down year, INTC still rates highly on many of my metrics for evaluating the financial performance of a company. It has a top-quintile return on invested capital (ROIC) of 20%, and its NOPAT margin has been increasing long-term despite decline over the past two years.
Cash flow is not an issue for INTC. The company generated $5.7 billion of free cash flow in 2012, and it has a war chest of over $23 billion of excess cash for R&D spending, acquisitions, paying dividends or buying back stock. Investors should not count out any company with those kinds of resources and a history of consistently high ROIC. Management has been good at allocating capital in the past, and I expect that trend to continue.
INTC Is a Great Value
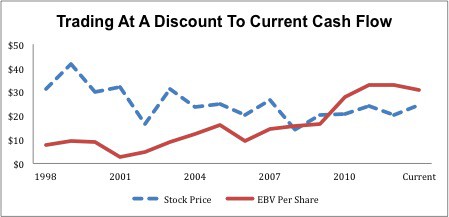
Now we get to the benefits of a fearful market. The bearish arguments and negative analyst ratings have done enough to keep INTC at a depressed valuation. At its current stock price of ~$24.40/share, INTC has a price to economic book value ratio of 0.8, which implies a permanent 20% decline in NOPAT. Figure 1 shows just how cheap this is compared to INTC’s historical valuation
As you can see, INTC’s stock price significantly outran its economic book value during the early 2000’s. Over the past decade, the stock price has remained nearly flat while profits have grown, so the company is now significantly undervalued. Figure 1 reminds me a lot of the pattern I saw when I wrote about Wal-Mart (WMT) back in July of 2011.
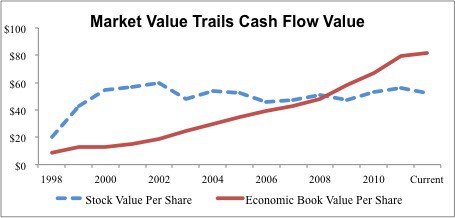
Figure 2: Wal-Mart’s Price-To-EBV Chart in 2011
Like INTC today, WMT’s valuation was flat for nearly a decade after overshooting its fundamentals around the turn of the century. By 2011, however, WMT was significantly undervalued, so I recommended it to investors. Since then, it has returned 50%, while the S&P 500 (SPY) returned 40%. I see similar outperformance in the future for INTC.
INTC’s ceiling may be even higher than Wal-Mart’s. The no-growth value of INTC is ~$31/share. If we assume rather modest profit growth, 6% compounded annual growth rate in NOPAT over a 12 year growth appreciation period, INTC is worth ~$50/share today.
We do not expect INTC to skyrocket up 100% in the short-term, but design wins for tablets in the near future and mobile phones starting in 2014 could prove to be catalysts to send the stock price upward. For the long-term investor, INTC has strong potential upside with relatively little downside risk due to its cheap valuation.
Good Funds With Exposure to INTC
Investors looking to hold INTC indirectly through an ETF or mutual fund should look to the following funds due to their Attractive ratings and 3% or more allocation to INTC.
1) iShares High Dividend ETF (HDV): 4.4% allocation to INTC and Attractive rating.
2) SunAmerica Series: Focused Dividend Strategy Portfolio (FDSBX, FDSTX, FDSWX): 3% allocation to INTC and Attractive rating.
Sam McBride contributed to this report
Disclosure: David Trainer is long INTC. David Trainer and Sam McBride receive no compensation to write about any specific stock, sector, or theme.
Photo credit: Motohiko Tokuriki (Flickr)


